Note
Go to the end to download the full example code or to run this example in your browser via JupyterLite.
Propagation delay causes forks (Decker and Wattenhofer 2013)#
Decker and Wattenhofer measured how long Bitcoin blocks took to reach the
network’s peers, and found that this delay alone explains most forks: while
a block is still propagating, miners that have not seen it keep working on
the old tip, and one of them may find a competing block. Since blocks are
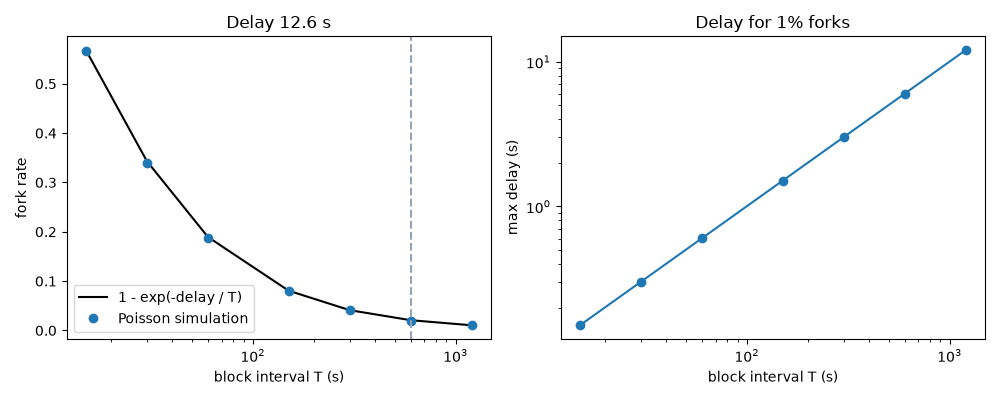
found as a Poisson process, the chance of a fork per block is about
1 - exp(-delay / interval).
What to look for#
With the authors’ measured mean delay of about 12.6 seconds and a 10-minute interval, about 2% of blocks fork, close to the 1.69% they observed. The rate climbs quickly as the interval shrinks toward the delay, which is why faster blockchains must also relay faster, or accept many more stale blocks and the security loss that comes with them.
The history behind this experiment: Breakthroughs in Peer-to-Peer Networking.
Model and simulation agree#
import matplotlib.pyplot as plt
import numpy as np

import blockchainkit as bk

delay = 12.6
bitcoin = bk.network.fork_rate(delay, 600)
print(f"predicted fork rate at 10 minutes: {bitcoin:.2%}")
assert 0.015 < bitcoin < 0.025

intervals = np.array([15, 30, 60, 150, 300, 600, 1200])
model = [bk.network.fork_rate(delay, float(t)) for t in intervals]
simulated = [
    bk.network.simulate_fork_rate(delay, float(t), blocks=20_000, seed=i)
    for i, t in enumerate(intervals)
]
for m, s in zip(model, simulated, strict=True):
    assert abs(m - s) < 0.01
print(f"at 15 seconds: {model[0]:.0%} of blocks fork")
predicted fork rate at 10 minutes: 2.08%
at 15 seconds: 57% of blocks fork
How fast must relay be?#
To keep forks below 1%, the delay must stay under about 1% of the interval.
budget = [-float(t) * float(np.log(1 - 0.01)) for t in intervals]
print({int(t): round(b, 2) for t, b in zip(intervals, budget, strict=True)})

fig, (left, right) = plt.subplots(1, 2, figsize=(10, 4))
left.semilogx(intervals, model, color="black", label="1 - exp(-delay / T)")
left.semilogx(intervals, simulated, "o", label="Poisson simulation")
left.axvline(600, color="#94a3b8", linestyle="--")
left.set(xlabel="block interval T (s)", ylabel="fork rate", title=f"Delay {delay} s")
left.legend()
right.loglog(intervals, budget, "o-")
right.set(xlabel="block interval T (s)", ylabel="max delay (s)", title="Delay for 1% forks")
fig.tight_layout()
{15: 0.15, 30: 0.3, 60: 0.6, 150: 1.51, 300: 3.02, 600: 6.03, 1200: 12.06}
Exercise#
Use bk.network.relay_cost to estimate the delay on a 500-peer random
graph with 8 links per peer when each one-way latency is 100 ms and
transmitting a 1 MB block takes 1 s per hop. Compare flooding with
inv/getdata.
Total running time of the script: (0 minutes 0.339 seconds)
