
Note
Go to the end to download the full example code.
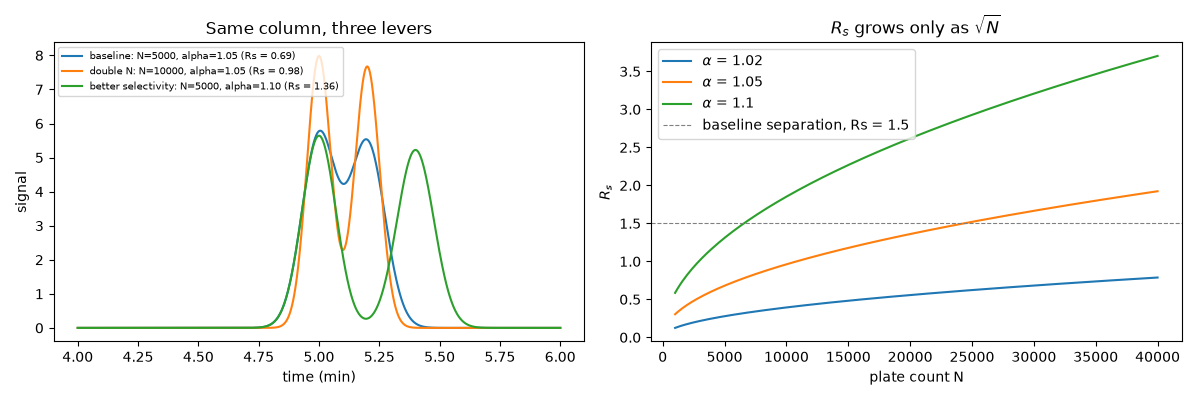
Purnell’s resolution equation: efficiency, selectivity, retention#
purnell_resolution() writes resolution as
\(R_s=\frac{\sqrt N}{4}\,\frac{\alpha-1}{\alpha}\,\frac{k_2}{1+k_2}\).
We check it against the direct peak-width formula
resolution() on simulated chromatograms,
then compare the three levers: doubling N only multiplies
\(R_s\) by \(\sqrt2\), whereas a small change in selectivity
\(\alpha\) can do much more.
import matplotlib.pyplot as plt
import numpy as np

from chemistrykit.analytical import purnell_resolution, resolution, selectivity_factor, simulate_chromatogram

t0 = 1.0
k1 = 4.0


def peaks(N, alpha):
    """Retention times, base widths, and direct resolution for a peak pair."""
    k2 = alpha * k1
    tR1, tR2 = t0 * (1 + k1), t0 * (1 + k2)
    w1, w2 = 4 * tR1 / np.sqrt(N), 4 * tR2 / np.sqrt(N)
    return tR1, tR2, resolution(tR1, tR2, w1, w2), k2


cases = {
    "baseline: N=5000, alpha=1.05": (5000.0, 1.05),
    "double N: N=10000, alpha=1.05": (10000.0, 1.05),
    "better selectivity: N=5000, alpha=1.10": (5000.0, 1.10),
}
for label, (N, alpha) in cases.items():
    tR1, tR2, Rs_direct, k2 = peaks(N, alpha)
    print(
        f"{label:40s}: alpha = {selectivity_factor(k1, k2):.2f}, Rs (Purnell) = {purnell_resolution(N, alpha, k2):.3f}, Rs (from peak widths) = {Rs_direct:.3f}"
    )
baseline: N=5000, alpha=1.05            : alpha = 1.05, Rs (Purnell) = 0.680, Rs (from peak widths) = 0.693
double N: N=10000, alpha=1.05           : alpha = 1.05, Rs (Purnell) = 0.962, Rs (from peak widths) = 0.980
better selectivity: N=5000, alpha=1.10  : alpha = 1.10, Rs (Purnell) = 1.309, Rs (from peak widths) = 1.360
fig, axes = plt.subplots(1, 2, figsize=(12, 4))
t = np.linspace(4.0, 6.0, 4000)
for label, (N, alpha) in cases.items():
    tR1, tR2, Rs, k2 = peaks(N, alpha)
    axes[0].plot(t, simulate_chromatogram(t, centers=[tR1, tR2], N=N), label=f"{label} (Rs = {Rs:.2f})")
axes[0].set_xlabel("time (min)")
axes[0].set_ylabel("signal")
axes[0].set_title("Same column, three levers")
axes[0].legend(fontsize=7)

N_grid = np.linspace(1000, 40000, 200)
for alpha in (1.02, 1.05, 1.10):
    axes[1].plot(N_grid, purnell_resolution(N_grid, alpha, alpha * k1), label=rf"$\alpha$ = {alpha}")
axes[1].axhline(1.5, color="gray", linestyle="--", linewidth=0.8, label="baseline separation, Rs = 1.5")
axes[1].set_xlabel("plate count N")
axes[1].set_ylabel(r"$R_s$")
axes[1].set_title(r"$R_s$ grows only as $\sqrt{N}$")
axes[1].legend()
plt.tight_layout()
plt.show()
Total running time of the script: (0 minutes 0.109 seconds)