
Examples#
This gallery walks through every public feature of
chemistrykit.analytical: redox and complexometric (EDTA)
titration-curve simulation with equivalence-point detection and Gran
plots (acid-base titrations are covered by chemistrykit.solutions’s
gallery); chromatographic plate theory, the van Deemter equation,
retention indices, and resolution; linear-regression calibration curves
with limits of detection/quantitation; propagation of uncertainty;
Dixon’s and Grubbs’ outlier tests; Student’s t intervals and the Horwitz
function; Savitzky-Golay smoothing; and stoichiometry and elemental
analysis (equation balancing, limiting reagents, empirical formulas).
Each script in this gallery is self-contained and can be run directly
with python examples/analytical/<section>/<script>.py. Every script
also carries an RST module docstring as its title/description and uses
# %% markers to split narrative text from code, which is exactly what
Sphinx-Gallery renders into the pages below – the script is the source
of truth for what you see, not a copy of it.
Sections#
titration – redox (Nernst) and EDTA titration curves with numerical equivalence-point detection, and the Gran plot.
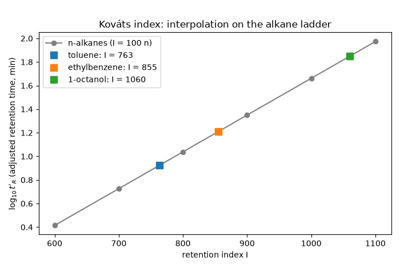
chromatography – Tsvet’s column separation, theoretical plates, the van Deemter and Golay equations, Kovats retention indices, and Purnell’s resolution equation.
calibration – a least-squares calibration curve and its limits of detection/quantitation.
uncertainty – propagation-of-uncertainty formulas for sums, products, and powers, cross-checked against a general numerical implementation.
qtest – Dixon’s Q-test and Grubbs’ test for rejecting a suspect outlier from a small data set.
statistics – Student’s t confidence intervals and the Horwitz interlaboratory-precision function.
smoothing – Savitzky-Golay smoothing and differentiation.
stoichiometry – Richter’s stoichiometry (balancing equations, equivalents, limiting reagents) and Liebig’s combustion analysis (empirical formulas).
Calibration curves#
Least-squares calibration lines, and the limits of detection and quantitation derived from their residual scatter.
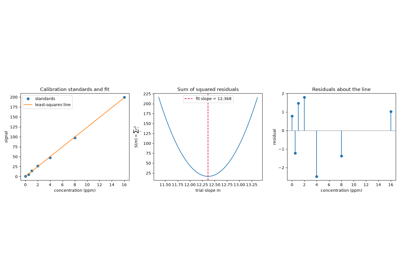
Legendre and Gauss’s least squares: fitting a calibration line
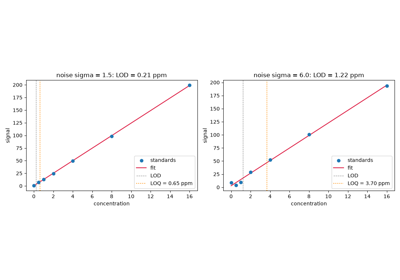
Limits of detection and quantitation from a calibration curve
Chromatography#
Tsvet’s column separation, theoretical plates, the van Deemter and Golay plate-height equations, Kovats retention indices, and Purnell’s resolution equation.
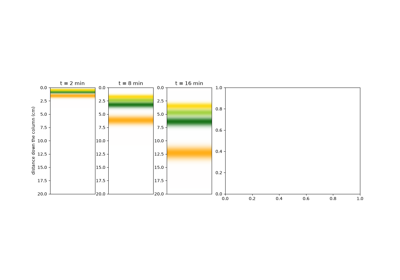
Tsvet’s column: separating leaf pigments into colored bands
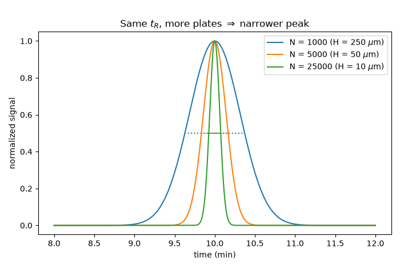
Martin and Synge’s theoretical plates from a peak’s width
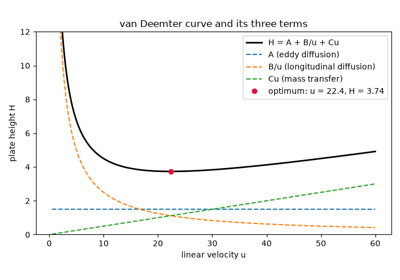
The van Deemter equation and the optimum flow velocity
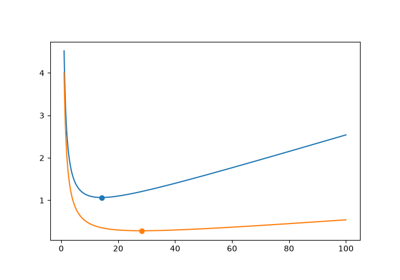
Golay’s open-tubular column: the van Deemter equation with A = 0
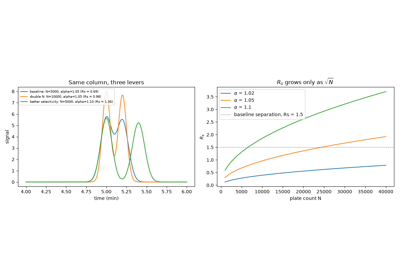
Purnell’s resolution equation: efficiency, selectivity, retention
Outlier rejection#
Dixon’s Q-test and Grubbs’ test for rejecting a suspect outlier from a small data set.

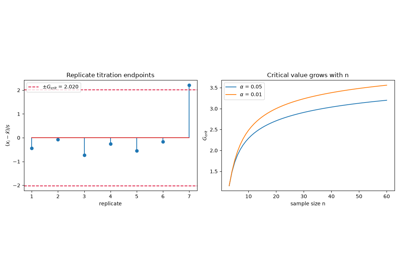
Grubbs’ outlier test: the extreme value in standard deviations
Signal smoothing#
Savitzky-Golay smoothing and differentiation of a noisy analytical signal.
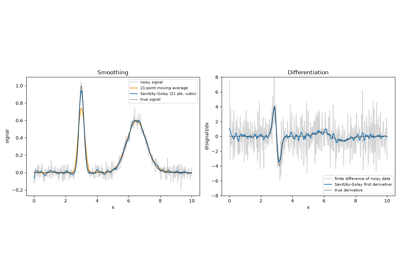
Savitzky-Golay smoothing and derivatives of a noisy spectrum
Statistics of replicate measurements#
Student’s t confidence interval for a mean of a few replicates, and the Horwitz function for expected interlaboratory precision.
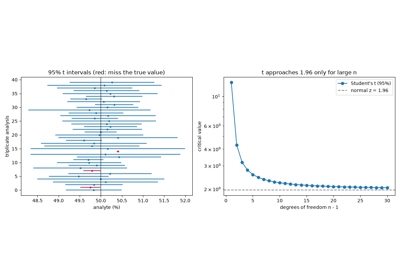
Student’s t: confidence intervals from a few replicates
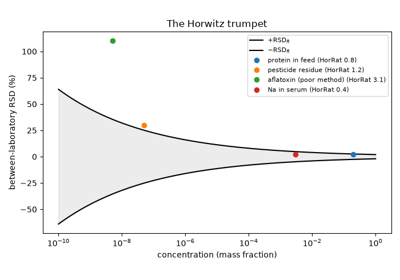
The Horwitz trumpet: interlaboratory precision vs. concentration
Stoichiometry and elemental analysis#
Balancing chemical equations, limiting reagents and yields, and empirical formulas from combustion-analysis data.
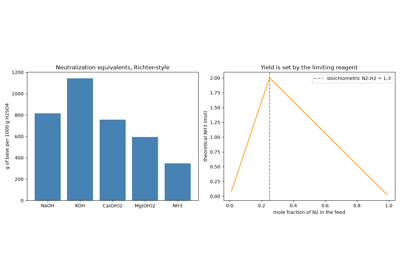
Richter’s stoichiometry: equivalent weights, balanced equations, limiting reagents
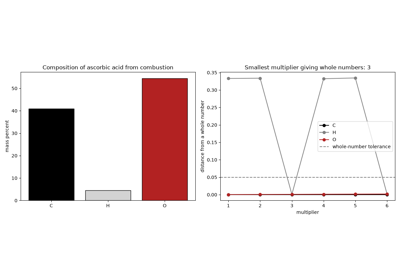
Liebig’s combustion analysis: an empirical formula from CO2 and H2O masses
Titration curves#
Potentiometric redox (Nernst) and EDTA complexometric titration curves, with equivalence points located by steepest change or by a Gran plot.
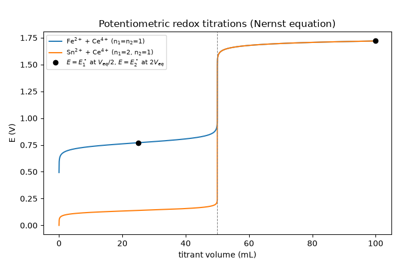
The Nernst equation in a potentiometric redox titration
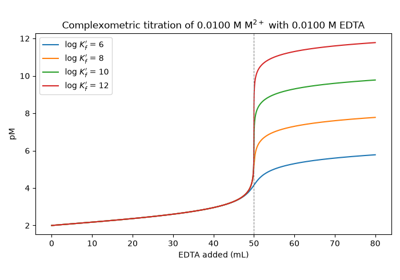
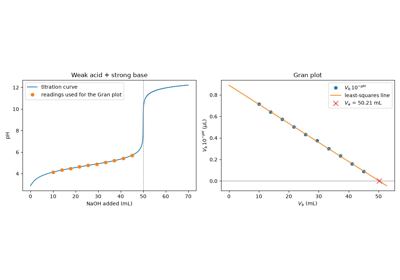
Gran plot: the equivalence point by linear extrapolation
Propagation of uncertainty#
Closed-form uncertainty-propagation formulas for sums, products, and powers, cross-checked against a general numerical implementation.

Propagation of uncertainty with the first-order (Ku) formula