
Note
Go to the end to download the full example code.
Student’s t: confidence intervals from a few replicates#
With only n replicates the standard deviation s is itself uncertain,
so the interval \(\bar x\pm t\,s/\sqrt n\) from
t_confidence_interval() uses Student’s
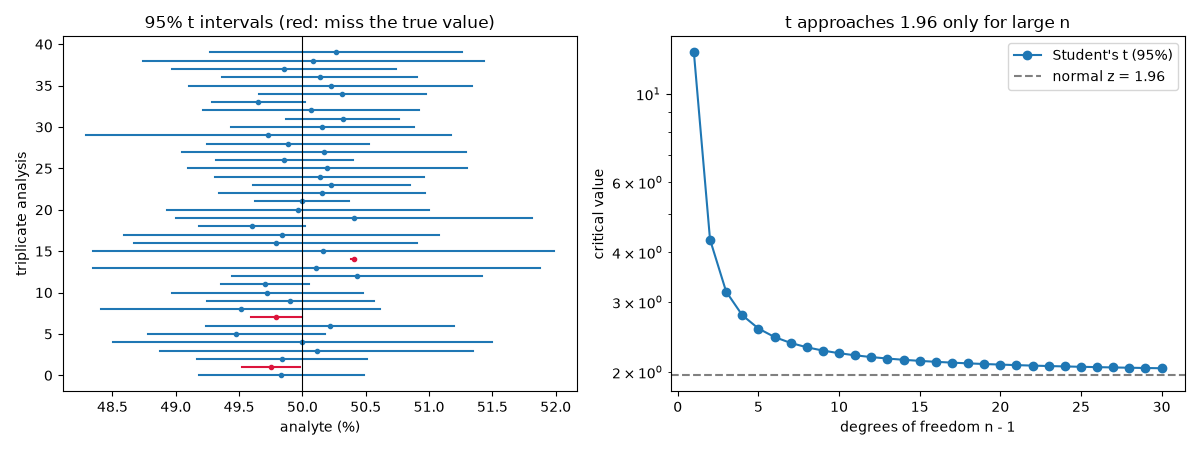
t instead of the normal 1.96. We simulate many triplicate analyses and
show that the t interval covers the true value 95% of the time, while
the naive \(\pm1.96\,s/\sqrt n\) interval falls well short.
import matplotlib.pyplot as plt
import numpy as np

from chemistrykit.analytical import t_confidence_interval

rng = np.random.default_rng(1908)
true_value, sigma, n = 50.00, 0.40, 3  # e.g. % analyte, triplicate analyses

ci = t_confidence_interval([50.21, 49.83, 50.36])
print(f"Triplicate: mean = {ci.mean:.3f}, s = {ci.std:.3f}, t(2 dof, 95%) = {ci.t_critical:.3f}")
print(f"95% interval: {ci.lower:.3f} to {ci.upper:.3f}")
Triplicate: mean = 50.133, s = 0.273, t(2 dof, 95%) = 4.303
95% interval: 49.455 to 50.812
trials = 5000
t_hits = z_hits = 0
intervals = []
for i in range(trials):
    data = rng.normal(true_value, sigma, size=n)
    ci = t_confidence_interval(data, confidence=0.95)
    t_hits += ci.lower <= true_value <= ci.upper
    z_half = 1.96 * ci.std / np.sqrt(n)
    z_hits += abs(ci.mean - true_value) <= z_half
    if i < 40:
        intervals.append(ci)
print(f"\nCoverage over {trials} triplicates: t interval {t_hits / trials:.3f}, naive 1.96 interval {z_hits / trials:.3f}")
Coverage over 5000 triplicates: t interval 0.945, naive 1.96 interval 0.814
fig, axes = plt.subplots(1, 2, figsize=(12, 4.5))
for i, ci in enumerate(intervals):
    color = "C0" if ci.lower <= true_value <= ci.upper else "crimson"
    axes[0].plot([ci.lower, ci.upper], [i, i], color=color)
    axes[0].plot([ci.mean], [i], "o", color=color, markersize=3)
axes[0].axvline(true_value, color="black", linewidth=0.8)
axes[0].set_xlabel("analyte (%)")
axes[0].set_ylabel("triplicate analysis")
axes[0].set_title("95% t intervals (red: miss the true value)")

dof = np.arange(1, 31)
t_vals = [t_confidence_interval(np.arange(d + 1, dtype=float)).t_critical for d in dof]
axes[1].plot(dof, t_vals, "o-", label="Student's t (95%)")
axes[1].axhline(1.96, color="gray", linestyle="--", label="normal z = 1.96")
axes[1].set_yscale("log")
axes[1].set_xlabel("degrees of freedom n - 1")
axes[1].set_ylabel("critical value")
axes[1].set_title("t approaches 1.96 only for large n")
axes[1].legend()
plt.tight_layout()
plt.show()
Total running time of the script: (0 minutes 0.221 seconds)