
Note
Go to the end to download the full example code.
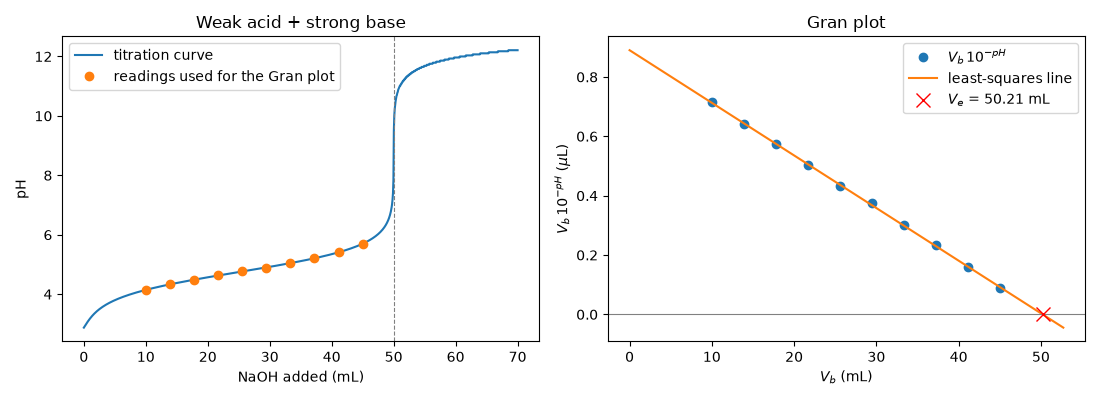
Gran plot: the equivalence point by linear extrapolation#
gran_plot() linearizes the buffer region
of a weak-acid titration: \(V_b\,10^{-pH}=K_a(V_e-V_b)\). Plotting
the left side against \(V_b\) gives a straight line whose
x-intercept is the equivalence volume and whose slope is \(-K_a\),
so the endpoint follows from data taken well before it.
import matplotlib.pyplot as plt
import numpy as np

from chemistrykit.analytical import gran_plot
from chemistrykit.solutions.systems.titration import WeakAcidStrongBaseTitration

# Acetic acid (Ka = 1.8e-5) titrated by NaOH: exact charge-balance pH.
titration = WeakAcidStrongBaseTitration(Ca=0.100, Va=0.050, Ka=1.8e-5, Cb=0.100)
V_eq_true = titration.equivalence_volume()

# "Measured" pH readings between 20% and 90% of the equivalence volume,
# with 0.005 pH-unit meter noise:
rng = np.random.default_rng(12)
V_data = np.linspace(0.2, 0.9, 10) * V_eq_true
pH_data = titration.pH_at(V_data) + rng.normal(scale=0.005, size=V_data.size)

result = gran_plot(V_data, pH_data)
print(f"Gran equivalence volume: {result.equivalence_volume * 1000:.3f} mL (true {V_eq_true * 1000:.3f} mL)")
print(f"Gran Ka from slope:      {result.Ka:.3e} (true 1.8e-05)")
Gran equivalence volume: 50.211 mL (true 50.000 mL)
Gran Ka from slope:      1.773e-05 (true 1.8e-05)
V_full = np.linspace(1e-6, 0.070, 1000)
fig, axes = plt.subplots(1, 2, figsize=(11, 4))
axes[0].plot(V_full * 1000, titration.pH_at(V_full), label="titration curve")
axes[0].plot(V_data * 1000, pH_data, "o", label="readings used for the Gran plot")
axes[0].axvline(V_eq_true * 1000, color="gray", linestyle="--", linewidth=0.8)
axes[0].set_xlabel("NaOH added (mL)")
axes[0].set_ylabel("pH")
axes[0].set_title("Weak acid + strong base")
axes[0].legend()

V_line = np.linspace(0.0, result.equivalence_volume * 1.05, 50)
axes[1].plot(result.V * 1000, result.gran_function * 1e6, "o", label=r"$V_b\,10^{-pH}$")
axes[1].plot(V_line * 1000, (result.slope * V_line + result.intercept) * 1e6, "-", label="least-squares line")
axes[1].axhline(0.0, color="gray", linewidth=0.8)
axes[1].plot([result.equivalence_volume * 1000], [0.0], "rx", markersize=10, label=f"$V_e$ = {result.equivalence_volume * 1000:.2f} mL")
axes[1].set_xlabel(r"$V_b$ (mL)")
axes[1].set_ylabel(r"$V_b\,10^{-pH}$ ($\mu$L)")
axes[1].set_title("Gran plot")
axes[1].legend()
plt.tight_layout()
plt.show()
Total running time of the script: (0 minutes 0.160 seconds)