
Note
Go to the end to download the full example code.
Tsvet’s column: separating leaf pigments into colored bands#
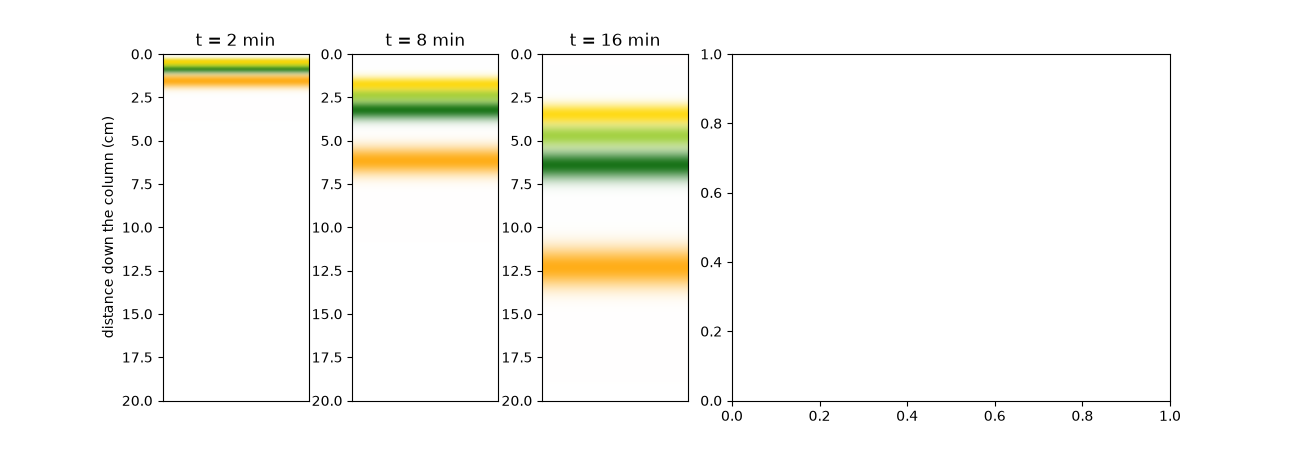
In Tsvet’s experiment a pigment extract moves down a chalk column, each
pigment at its own speed \(u/(1+k)\) set by how strongly it is
retained (retention factor k). Snapshots of the column show the
mixture resolving into separate colored bands; at the column outlet a
detector records the same separation as a chromatogram, rendered here by
simulate_chromatogram().
import matplotlib.pyplot as plt
import numpy as np

from chemistrykit.analytical import retention_factor, simulate_chromatogram

# Illustrative pigments, fastest (least retained) first, with made-up
# but plausible retention factors on a polar adsorbent.
pigments = {
    "carotenes": (0.3, "orange"),
    "chlorophyll a": (1.5, "darkgreen"),
    "chlorophyll b": (2.4, "yellowgreen"),
    "xanthophylls": (3.6, "gold"),
}
L = 20.0  # column length, cm
u = 1.0  # mobile-phase velocity, cm/min
N = 400  # modest plate count, as for a hand-packed column
t0 = L / u
sigma_per_length = 1.0 / np.sqrt(N)  # band std. dev. per cm traveled (plate theory: sigma = x/sqrt(N) at the outlet)
Band positions after various elution times:
z = np.linspace(0.0, L, 800)
snapshots = [2.0, 8.0, 16.0]
fig, axes = plt.subplots(1, len(snapshots) + 1, figsize=(13, 4.5), gridspec_kw={"width_ratios": [1, 1, 1, 3]})
for ax, t in zip(axes[:-1], snapshots, strict=True):
    img = np.ones((z.size, 20, 3))
    for k, color in pigments.values():
        x = u * t / (1.0 + k)  # distance traveled by this band
        s = max(np.sqrt(x * L) * sigma_per_length, 0.05)
        band = np.exp(-0.5 * ((z - x) / s) ** 2)[:, None, None]
        img = img * (1 - 0.9 * band) + 0.9 * band * np.array(plt.matplotlib.colors.to_rgb(color))
    ax.imshow(img, extent=[0, 1, L, 0], aspect="auto")
    ax.set_xticks([])
    ax.set_title(f"t = {t:.0f} min")
axes[0].set_ylabel("distance down the column (cm)")
Text(116.22222222222221, 0.5, 'distance down the column (cm)')
The detector trace at the column outlet:
tR = [t0 * (1.0 + k) for k, _ in pigments.values()]
t = np.linspace(0.0, 1.2 * max(tR), 4000)
trace = simulate_chromatogram(t, centers=tR, N=N)
axes[-1].plot(t, trace, color="black")
for (name, (_k, color)), tr in zip(pigments.items(), tR, strict=True):
    axes[-1].axvspan(tr - 1, tr + 1, color=color, alpha=0.4)
    axes[-1].text(tr, 1.05, name, ha="center", fontsize=8)
    print(f"{name:14s}: t_R = {tr:5.1f} min, k = {retention_factor(tr, t0):.2f}")
axes[-1].set_ylim(0, 1.2)
axes[-1].set_xlabel("time (min)")
axes[-1].set_ylabel("detector signal")
axes[-1].set_title("Outlet chromatogram")
plt.tight_layout()
plt.show()

carotenes     : t_R =  26.0 min, k = 0.30
chlorophyll a : t_R =  50.0 min, k = 1.50
chlorophyll b : t_R =  68.0 min, k = 2.40
xanthophylls  : t_R =  92.0 min, k = 3.60
Total running time of the script: (0 minutes 0.057 seconds)