
Note
Go to the end to download the full example code.
Grubbs’ outlier test: the extreme value in standard deviations#
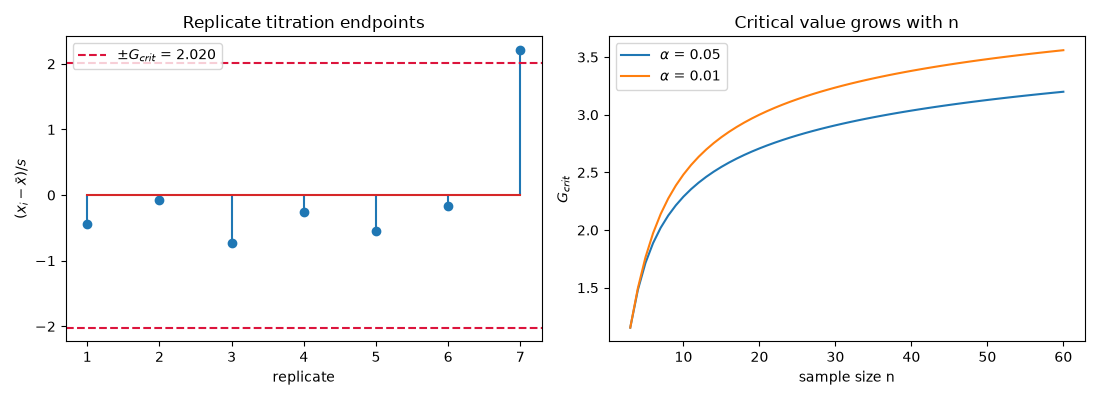
grubbs_test() computes
\(G=\max_i|x_i-\bar x|/s\) and compares it with the critical value
grubbs_critical_value(), derived from
Student’s t distribution so that it exists for any sample size. A Monte
Carlo run on outlier-free normal data confirms that the test falsely
rejects a point at the nominal rate \(\alpha\).
import matplotlib.pyplot as plt
import numpy as np

from chemistrykit.analytical import grubbs_critical_value, grubbs_test

replicates = [24.51, 24.55, 24.48, 24.53, 24.50, 24.54, 24.79]  # mL, one suspicious endpoint
result = grubbs_test(replicates, alpha=0.05)
print(f"suspect = {result.suspect_value}, G = {result.G_statistic:.3f}, G_crit(n=7, 5%) = {result.G_critical:.3f} -> {'REJECT' if result.reject else 'retain'}")
suspect = 24.79, G = 2.208, G_crit(n=7, 5%) = 2.020 -> REJECT
False-rejection rate on clean normal data, for several sample sizes:
rng = np.random.default_rng(2024)
sizes = [4, 6, 10, 20, 40]
rates = []
for n in sizes:
    rejections = sum(grubbs_test(rng.normal(size=n), alpha=0.05).reject for _ in range(4000))
    rates.append(rejections / 4000)
    print(f"n = {n:2d}: G_crit = {grubbs_critical_value(n):.3f}, false-rejection rate = {rates[-1]:.3f} (nominal 0.05)")
n =  4: G_crit = 1.481, false-rejection rate = 0.051 (nominal 0.05)
n =  6: G_crit = 1.887, false-rejection rate = 0.050 (nominal 0.05)
n = 10: G_crit = 2.290, false-rejection rate = 0.048 (nominal 0.05)
n = 20: G_crit = 2.708, false-rejection rate = 0.054 (nominal 0.05)
n = 40: G_crit = 3.036, false-rejection rate = 0.053 (nominal 0.05)
fig, axes = plt.subplots(1, 2, figsize=(11, 4))
x = np.asarray(replicates)
z = (x - x.mean()) / x.std(ddof=1)
axes[0].stem(np.arange(1, len(x) + 1), z)
axes[0].axhline(result.G_critical, color="crimson", linestyle="--", label=f"$\\pm G_{{crit}}$ = {result.G_critical:.3f}")
axes[0].axhline(-result.G_critical, color="crimson", linestyle="--")
axes[0].set_xlabel("replicate")
axes[0].set_ylabel(r"$(x_i-\bar x)/s$")
axes[0].set_title("Replicate titration endpoints")
axes[0].legend()

n_grid = np.arange(3, 61)
axes[1].plot(n_grid, [grubbs_critical_value(n, 0.05) for n in n_grid], label=r"$\alpha$ = 0.05")
axes[1].plot(n_grid, [grubbs_critical_value(n, 0.01) for n in n_grid], label=r"$\alpha$ = 0.01")
axes[1].set_xlabel("sample size n")
axes[1].set_ylabel(r"$G_{crit}$")
axes[1].set_title("Critical value grows with n")
axes[1].legend()
plt.tight_layout()
plt.show()
Total running time of the script: (0 minutes 0.599 seconds)