
Note
Go to the end to download the full example code.
Bravais lattices: the 14 lattices and the three cubic centerings#
Bravais (1848) showed there are exactly 14 distinct three-dimensional
lattices: the 7 crystal systems combined with the centerings each allows
(BRAVAIS_LATTICES).
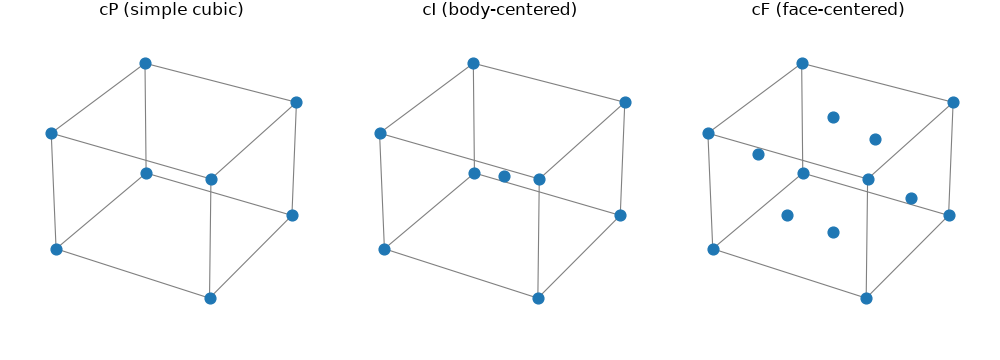
The cubic system has three – primitive (P), body-centered (I), and
face-centered (F) – drawn here with
cubic_lattice_points().
import matplotlib.pyplot as plt
import numpy as np

from chemistrykit.crystal.systems.crystal_systems import BRAVAIS_LATTICES, cubic_lattice_points

for system, centerings in BRAVAIS_LATTICES.items():
    print(f"{system:13s} {', '.join(centerings)}")
total = sum(len(c) for c in BRAVAIS_LATTICES.values())
print(f"\nTotal Bravais lattices: {total}")
assert total == 14
cubic         P, I, F
tetragonal    P, I
orthorhombic  P, C, I, F
hexagonal     P
trigonal      R
monoclinic    P, C
triclinic     P

Total Bravais lattices: 14
Lattice points per conventional cell (corners shared by 8 cells, faces by 2) and the nearest-neighbor distance, measured from the generated points:
for centering, name in (("P", "primitive"), ("I", "body-centered"), ("F", "face-centered")):
    pts = cubic_lattice_points(centering, a=1.0, n_cells=4)
    per_cell = np.sum(np.all(pts < 4.0 - 1e-9, axis=1)) / 4**3
    dists = np.linalg.norm(pts[:, None, :] - pts[None, :, :], axis=-1)
    d_nn = dists[dists > 1e-9].min()
    n_nn = np.sum(np.isclose(dists[np.argmin(np.linalg.norm(pts - 2.0, axis=1))], d_nn))
    print(f"c{centering} ({name:13s}): {per_cell:.0f} lattice point(s)/cell, nearest neighbor {d_nn:.4f} a, {n_nn} neighbors")
cP (primitive    ): 1 lattice point(s)/cell, nearest neighbor 1.0000 a, 6 neighbors
cI (body-centered): 2 lattice point(s)/cell, nearest neighbor 0.8660 a, 8 neighbors
cF (face-centered): 4 lattice point(s)/cell, nearest neighbor 0.7071 a, 12 neighbors
fig = plt.figure(figsize=(10, 3.6))
edges = [(p, q) for p in np.ndindex(2, 2, 2) for q in np.ndindex(2, 2, 2) if np.sum(np.abs(np.subtract(p, q))) == 1 and p < q]
for i, (centering, title) in enumerate((("P", "cP (simple cubic)"), ("I", "cI (body-centered)"), ("F", "cF (face-centered)"))):
    ax = fig.add_subplot(1, 3, i + 1, projection="3d")
    for p, q in edges:
        ax.plot(*zip(p, q, strict=True), color="gray", lw=0.8)
    pts = cubic_lattice_points(centering)
    ax.scatter(pts[:, 0], pts[:, 1], pts[:, 2], s=60, color="C0", depthshade=False)
    ax.set_title(title)
    ax.set_axis_off()
plt.tight_layout()
plt.show()
Total running time of the script: (0 minutes 0.054 seconds)