
Ctrl+K
chemistrykit logo chemistrykit logo
  • Subpackages
  • History
  • Examples
  • API
  • GitHub
  • PyPI
  • Subpackages
  • History
  • Examples
  • API
  • GitHub
  • PyPI

Section Navigation

  • chemistrykit.analytical
    • Calibration curves
    • Chromatography
    • Outlier rejection
    • Signal smoothing
    • Statistics of replicate measurements
    • Titration curves
    • Propagation of uncertainty
  • chemistrykit.crystal
    • Crystal chemistry
    • Crystal systems
    • Point defects
    • Lattice energy
    • Madelung constant
    • Hard-sphere packing
    • Powder XRD
  • chemistrykit.electrochem
    • Battery discharge
    • Butler-Volmer kinetics
    • Electrolytic conductivity
    • Electrolysis
    • Fuel cells
    • The Nernst equation
    • Standard reduction potentials
    • Electroanalytical currents
  • chemistrykit.kinetics
    • Arrhenius equation
    • Enzyme kinetics
    • Reaction networks
    • Oscillating reactions
    • Rate laws
    • Rate theory
  • chemistrykit.md
    • Constraints
    • Lennard-Jones fluid
    • Pair potentials
    • Periodic boundaries
    • Thermostats
  • chemistrykit.photochem
    • Chemical actinometry
    • Photochemical chain reactions
    • Photoinduced electron transfer
    • Energy transfer
    • Fluorescence observables
    • Jablonski-diagram kinetics
    • Photostationary state
    • Quantum yields
    • Stern-Volmer quenching
  • chemistrykit.polymer
    • Chain-growth kinetics
    • Chain statistics
    • Molecular-weight distribution
    • Solution properties
    • Step-growth kinetics
    • Stereochemistry
  • chemistrykit.quantum
    • Harmonic oscillator vs. Morse potential
    • Minimal variational H2+ and the LCAO method
    • Variational helium atom
    • Huckel molecular-orbital theory
    • Hydrogen-like atoms
    • Particle in a box
    • Rayleigh-Schrodinger perturbation theory
    • Rigid rotor
  • chemistrykit.solutions
    • Acid-base equilibria
    • Activity coefficients
    • Solubility equilibria
    • Titration curves
  • chemistrykit.spectro
    • Atomic line spectra
    • Beer-Lambert law
    • Electronic spectra
    • Spectral lineshapes
    • NMR spectroscopy
    • Rotational spectra
    • Vibrational spectra
  • chemistrykit.statmech
    • Ising model
    • Lattice-gas adsorption
    • Maxwell-Boltzmann speed distribution
    • Partition functions
    • Quantum statistics and the classical limit
    • Heat capacity of solids
    • Virial coefficients
  • chemistrykit.structure
    • Bond order
    • Dipole moments
    • Kekulé structures
    • Lewis structures, oxidation states, and electronegativity
    • Point-group determination
    • Ring strain
    • VSEPR geometry prediction
  • chemistrykit.surface
    • BET isotherm
    • Catalysis
    • Polanyi potential and Dubinin-Radushkevich
    • Eley-Rideal kinetics
    • Freundlich isotherm
    • Gibbs adsorption equation
    • Langmuir isotherm
    • Langmuir-Hinshelwood kinetics
    • Temkin isotherm
    • Temperature-programmed desorption
  • Sections
  • Examples
  • Examples
  • Lattice energy
  • Shannon’s effective ionic radii: additivity and periodic trends

Note

Go to the end to download the full example code.

Shannon’s effective ionic radii: additivity and periodic trends#

Shannon (1976) fitted one self-consistent radius per ion (for a given coordination number) so that cation-anion distances in thousands of crystals are reproduced by simple sums \(r_++r_-\). SHANNON_IONIC_RADII_PM holds the 6-coordinate values; here their sums are checked against measured rock-salt nearest-neighbor distances, and their periodic trends are plotted.

import matplotlib.pyplot as plt

from chemistrykit.crystal.utils.reference_data import SHANNON_IONIC_RADII_PM as R

measured_r0 = {  # rock-salt nearest-neighbor distances, pm
    ("Li+", "F-"): 201.0,
    ("Na+", "F-"): 232.0,
    ("Na+", "Cl-"): 282.0,
    ("K+", "Cl-"): 315.0,
    ("K+", "Br-"): 330.0,
    ("Rb+", "I-"): 367.0,
    ("Mg2+", "O2-"): 211.0,
    ("Ca2+", "O2-"): 240.0,
}
sums, measured, labels = [], [], []
for (cat, an), r0 in measured_r0.items():
    s = R[cat] + R[an]
    sums.append(s)
    measured.append(r0)
    labels.append(f"{cat.rstrip('+2')}{an.rstrip('-2')}")
    print(f"{cat:5s}+{an:4s} r+ + r- = {s:6.1f} pm   measured r0 = {r0:6.1f} pm   ({(s - r0) / r0:+.1%})")
    assert abs(s - r0) / r0 < 0.05
Li+  +F-   r+ + r- =  209.0 pm   measured r0 =  201.0 pm   (+4.0%)
Na+  +F-   r+ + r- =  235.0 pm   measured r0 =  232.0 pm   (+1.3%)
Na+  +Cl-  r+ + r- =  283.0 pm   measured r0 =  282.0 pm   (+0.4%)
K+   +Cl-  r+ + r- =  319.0 pm   measured r0 =  315.0 pm   (+1.3%)
K+   +Br-  r+ + r- =  334.0 pm   measured r0 =  330.0 pm   (+1.2%)
Rb+  +I-   r+ + r- =  372.0 pm   measured r0 =  367.0 pm   (+1.4%)
Mg2+ +O2-  r+ + r- =  212.0 pm   measured r0 =  211.0 pm   (+0.5%)
Ca2+ +O2-  r+ + r- =  240.0 pm   measured r0 =  240.0 pm   (+0.0%)
fig, axes = plt.subplots(1, 2, figsize=(11, 4))
alkali = ["Li+", "Na+", "K+", "Rb+", "Cs+"]
halide = ["F-", "Cl-", "Br-", "I-"]
axes[0].plot(range(len(alkali)), [R[i] for i in alkali], "o-", label="alkali cations (M+)")
axes[0].plot(range(len(halide)), [R[i] for i in halide], "s-", label="halide anions (X-)")
axes[0].set_xticks(range(5), ["period 2", "3", "4", "5", "6"])
axes[0].set_ylabel("Shannon radius, CN 6 (pm)")
axes[0].set_title("Radii grow down a group")
axes[0].legend()
axes[1].scatter(measured, sums)
for label, x, y in zip(labels, measured, sums, strict=True):
    axes[1].annotate(label, (x, y), textcoords="offset points", xytext=(5, -10))
axes[1].plot([190, 380], [190, 380], "k--", lw=0.8)
axes[1].set_xlabel("measured r0 (pm)")
axes[1].set_ylabel(r"Shannon $r_+ + r_-$ (pm)")
axes[1].set_title("Additivity of Shannon radii")
plt.tight_layout()
plt.show()
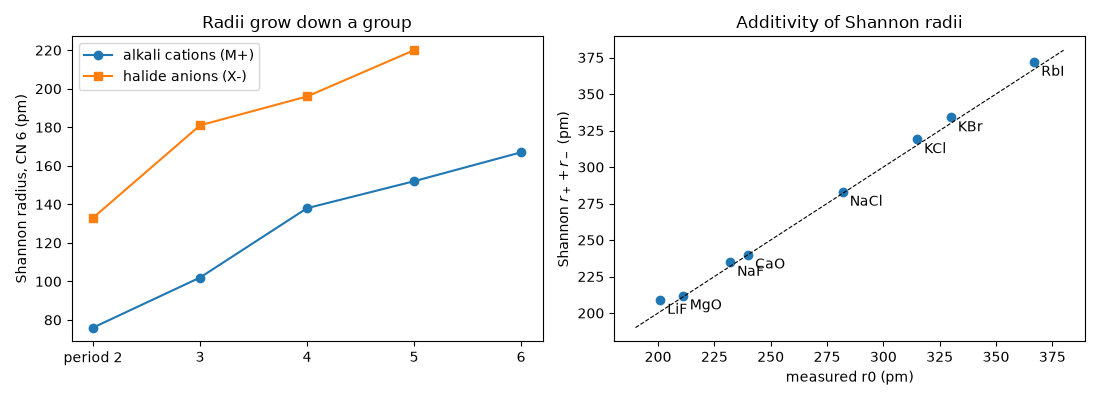
Radii grow down a group, Additivity of Shannon radii

Total running time of the script: (0 minutes 0.070 seconds)

Download Jupyter notebook: plot_03_shannon_ionic_radii.ipynb

Download Python source code: plot_03_shannon_ionic_radii.py

Download zipped: plot_03_shannon_ionic_radii.zip

Gallery generated by Sphinx-Gallery

previous

Kapustinskii equation: lattice energy without a crystal structure

next

Madelung constant

Show Source

© Copyright 2026, chemistrykit contributors.

Created using Sphinx 9.1.0.

Built with the PyData Sphinx Theme 0.21.0.