
Note
Go to the end to download the full example code.
The hydrogen-oxygen explosion peninsula#
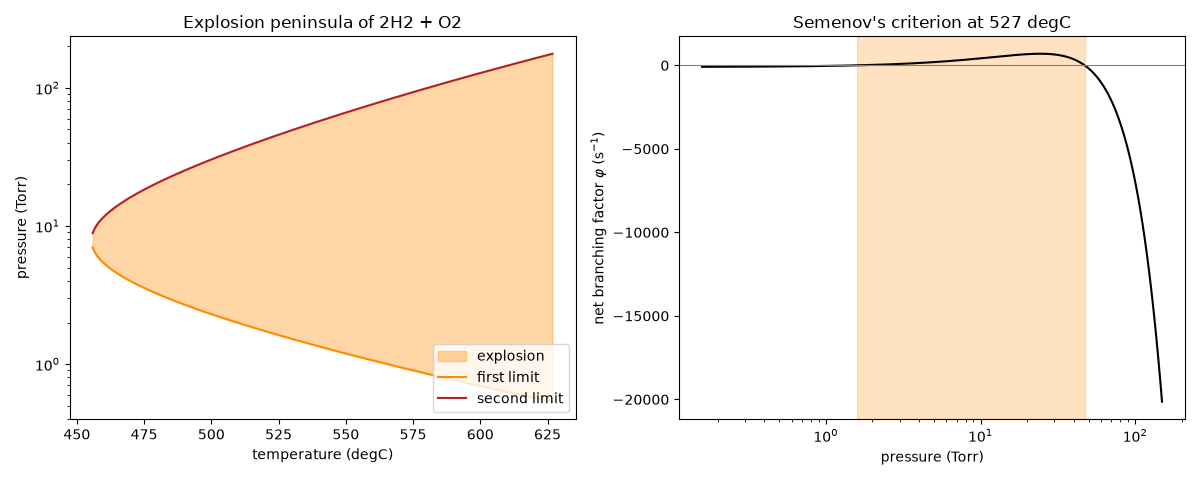
In the H2/O2 chain the branching step \(H + O_2 \to OH + O\) (net two
extra H atoms per event) competes with H loss at the vessel wall and with
the three-body \(H + O_2 + M \to HO_2 + M\). Semenov’s net branching
factor
(branching_factor()),
is positive, and the mixture explodes, only between two pressures: the first limit, where branching beats wall loss, and the second, where three-body termination catches up. Because \(k_b\) has a large activation energy and \(k_t\) has almost none, the window widens with temperature and closes at a tip. That traces the famous explosion peninsula. The Arrhenius parameters are of the size measured for these reactions; the wall rate depends on the vessel. The third, thermal limit at higher pressure comes from self-heating and is not part of this isothermal model.
import matplotlib.pyplot as plt
import numpy as np

from chemistrykit.constants import R
from chemistrykit.kinetics import ChainBranchingExplosion, arrhenius_rate_constant

model = ChainBranchingExplosion(
    k_branch=lambda T: arrhenius_rate_constant(A=1.9e8, Ea=70.3e3, T=T),  # m^3 mol^-1 s^-1
    k_wall=100.0,  # s^-1
    k_termination=1.0e4,  # m^6 mol^-2 s^-1
    x_O2=1.0 / 3.0,
)

T = np.linspace(600.0, 900.0, 301)
limits = [model.explosion_limits(t) for t in T]
mask = np.array([lim is not None for lim in limits])
P1 = np.array([lim[0] if lim else np.nan for lim in limits])
P2 = np.array([lim[1] if lim else np.nan for lim in limits])
T_tip = T[mask][0]

fig, axes = plt.subplots(1, 2, figsize=(12, 4.8))
axes[0].fill_between(T[mask] - 273.15, P1[mask] / 133.322, P2[mask] / 133.322, color="darkorange", alpha=0.35, label="explosion")
axes[0].semilogy(T - 273.15, P1 / 133.322, color="darkorange", label="first limit")
axes[0].semilogy(T - 273.15, P2 / 133.322, color="firebrick", label="second limit")
axes[0].set_xlabel("temperature (degC)")
axes[0].set_ylabel("pressure (Torr)")
axes[0].set_title("Explosion peninsula of 2H2 + O2")
axes[0].legend(loc="lower right")

T0 = 800.0
p1, p2 = model.explosion_limits(T0)
P = np.logspace(np.log10(p1) - 1, np.log10(p2) + 0.5, 400)
axes[1].semilogx(P / 133.322, model.branching_factor(P, T0), color="black")
axes[1].axhline(0.0, color="gray", linewidth=0.8)
axes[1].axvspan(p1 / 133.322, p2 / 133.322, color="darkorange", alpha=0.25)
axes[1].set_xlabel("pressure (Torr)")
axes[1].set_ylabel(r"net branching factor $\varphi$ (s$^{-1}$)")
axes[1].set_title(f"Semenov's criterion at {T0 - 273.15:.0f} degC")
fig.tight_layout()
Either side of the second limit, the H-atom population either levels off at \(w_0/|\varphi|\) or grows exponentially:
for P_test in (0.5 * p2, 1.5 * p2):
    n = model.carrier_concentration([0.0, 0.005, 0.01], P_test, T0, w0=1e-6)
    print(f"P = {P_test / 133.322:6.1f} Torr, phi = {float(model.branching_factor(P_test, T0)):8.1f} s^-1, n(t) = {np.array2string(n, precision=3)}")
print(f"peninsula tip near {T_tip - 273.15:.0f} degC; second limit at {T0 - 273.15:.0f} degC = {p2 / 133.322:.0f} Torr")
print(f"second-limit concentration {p2 / (R * T0):.3f} mol/m^3; wall-free limit 2 k_b / k_t = {2 * model.k_branch(T0) / 1.0e4:.3f}")

plt.show()
P =   23.6 Torr, phi =    694.1 s^-1, n(t) = [0.000e+00 4.488e-08 1.488e-06]
P =   70.7 Torr, phi =  -2182.3 s^-1, n(t) = [0.000e+00 4.582e-10 4.582e-10]
peninsula tip near 456 degC; second limit at 527 degC = 47 Torr
second-limit concentration 0.945 mol/m^3; wall-free limit 2 k_b / k_t = 0.977
Total running time of the script: (0 minutes 0.189 seconds)