
Note
Go to the end to download the full example code.
Ziegler-Natta stereocontrol: isotactic vs. atactic polypropylene#
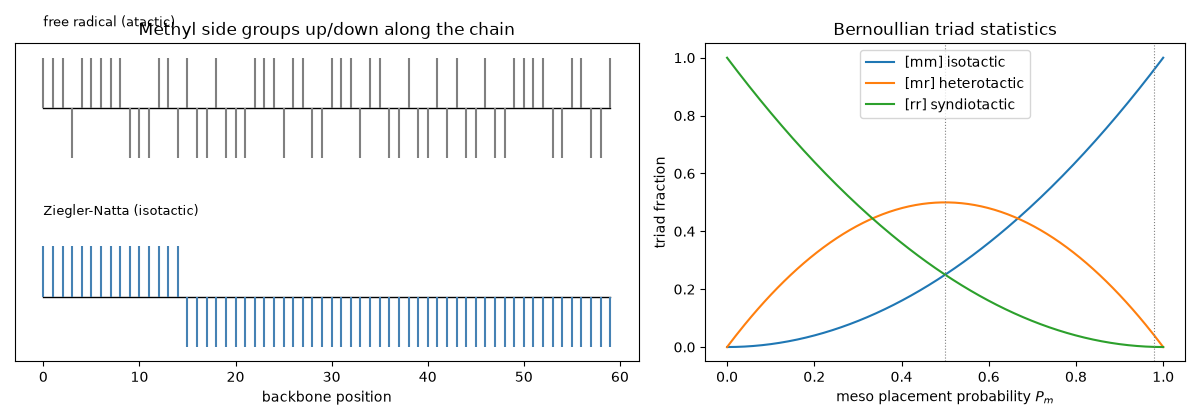
Natta’s Ziegler-type catalysts insert each propylene with the same
orientation, giving isotactic polypropylene (every methyl on the same
side, nearly all meso dyads), whereas free-radical placement is close to
random (atactic). With meso-placement probability \(P_m\)
(Bernoullian statistics), the NMR-observable triad fractions are
\([mm]=P_m^2\), \([mr]=2P_m(1-P_m)\), \([rr]=(1-P_m)^2\)
(bernoullian_triad_fractions()),
and isotactic runs average \(1/(1-P_m)\) dyads
(mean_isotactic_run_length()).
Seeded dyad sequences
(sample_dyad_sequence())
make the difference visible.
import matplotlib.pyplot as plt
import numpy as np

from chemistrykit.polymer.systems.tacticity import (
    bernoullian_triad_fractions,
    mean_isotactic_run_length,
    sample_dyad_sequence,
)

catalysts = {"free radical (atactic)": 0.5, "Ziegler-Natta (isotactic)": 0.98}
for label, Pm in catalysts.items():
    mm, mr, rr = bernoullian_triad_fractions(Pm)
    s = sample_dyad_sequence(100000, Pm, rng=1)
    mm_sim = np.mean(s[:-1] & s[1:])
    run = mean_isotactic_run_length(Pm)
    print(f"{label:28s} Pm={Pm:.2f}: [mm]={mm:.3f} (sampled {mm_sim:.3f}), [mr]={mr:.3f}, [rr]={rr:.3f}, mean isotactic run = {run:.0f} dyads")
free radical (atactic)       Pm=0.50: [mm]=0.250 (sampled 0.251), [mr]=0.500, [rr]=0.250, mean isotactic run = 2 dyads
Ziegler-Natta (isotactic)    Pm=0.98: [mm]=0.960 (sampled 0.961), [mr]=0.039, [rr]=0.000, mean isotactic run = 50 dyads
fig, axes = plt.subplots(1, 2, figsize=(12, 4.2), gridspec_kw={"width_ratios": [1.3, 1]})
n = 60
for row, (label, Pm) in enumerate(catalysts.items()):
    meso = sample_dyad_sequence(n - 1, Pm, rng=row + 3)
    # side of each methyl: stays the same across a meso dyad, flips across racemo
    side = np.concatenate([[1], np.where(np.cumsum(~meso) % 2 == 0, 1, -1)])
    y0 = -3.0 * row
    axes[0].plot(np.arange(n), np.full(n, y0), "k-", lw=1)
    axes[0].vlines(np.arange(n), y0, y0 + 0.8 * side, color="steelblue" if row else "gray")
    axes[0].text(0, y0 + 1.3, label, fontsize=9)
axes[0].set_yticks([])
axes[0].set_xlabel("backbone position")
axes[0].set_title("Methyl side groups up/down along the chain")

Pm_grid = np.linspace(0, 1, 200)
mm, mr, rr = bernoullian_triad_fractions(Pm_grid)
axes[1].plot(Pm_grid, mm, label="[mm] isotactic")
axes[1].plot(Pm_grid, mr, label="[mr] heterotactic")
axes[1].plot(Pm_grid, rr, label="[rr] syndiotactic")
for Pm in catalysts.values():
    axes[1].axvline(Pm, color="gray", ls=":", lw=0.8)
axes[1].set_xlabel("meso placement probability $P_m$")
axes[1].set_ylabel("triad fraction")
axes[1].set_title("Bernoullian triad statistics")
axes[1].legend()
plt.tight_layout()
plt.show()
Total running time of the script: (0 minutes 0.069 seconds)