
Note
Go to the end to download the full example code.
Gran’s plot: finding the equivalence point by linear extrapolation#
Near the equivalence point a titration curve is steep and hard to sample. Gran observed that before the equivalence point of a strong acid titrated with a strong base,
\[G = (V_a + V_b)\,10^{-\mathrm{pH}} = C_a V_a - C_b V_b,\]
a straight line in the titrant volume \(V_b\) that reaches zero
exactly at the equivalence volume. Fitting it with
gran_plot() recovers
\(V_e\) from noisy pre-equivalence readings alone, without knowing
either concentration.
import matplotlib.pyplot as plt
import numpy as np

from chemistrykit.solutions.systems.titration import StrongAcidStrongBaseTitration, gran_plot

titration = StrongAcidStrongBaseTitration(Ca=0.100, Va=0.050, Cb=0.100)
Ve = titration.equivalence_volume()

rng = np.random.default_rng(0)
Vb_data = np.linspace(0.30 * Ve, 0.95 * Ve, 12)
pH_data = titration.pH_at(Vb_data) + rng.normal(0.0, 0.01, Vb_data.size)  # +-0.01 pH meter noise

result = gran_plot(Vb_data, pH_data, Va=titration.Va)

fig, (ax1, ax2) = plt.subplots(1, 2, figsize=(12, 4.5))
Vb_curve = np.linspace(1e-6, 1.4 * Ve, 500)
ax1.plot(Vb_curve * 1000, titration.pH_at(Vb_curve), color="gray", label="exact titration curve")
ax1.plot(Vb_data * 1000, pH_data, "o", color="steelblue", label="measured points used")
ax1.axvline(Ve * 1000, color="gray", linestyle=":")
ax1.set_xlabel("volume of NaOH added (mL)")
ax1.set_ylabel("pH")
ax1.set_title("Pre-equivalence data only")
ax1.legend(fontsize=8)

V_line = np.linspace(0, result.equivalence_volume, 2)
ax2.plot(result.Vb * 1000, result.G * 1000, "o", color="steelblue", label="Gran function")
ax2.plot(V_line * 1000, (result.intercept + result.slope * V_line) * 1000, color="darkorange", label="least-squares line")
ax2.axhline(0, color="gray", linewidth=0.7)
ax2.axvline(Ve * 1000, color="gray", linestyle=":", label="true $V_e$")
ax2.set_xlabel("volume of NaOH added (mL)")
ax2.set_ylabel(r"$G = (V_a+V_b)10^{-\mathrm{pH}}$ (mmol)")
ax2.set_title("Gran plot: x-intercept = equivalence volume")
ax2.legend(fontsize=8)
fig.tight_layout()
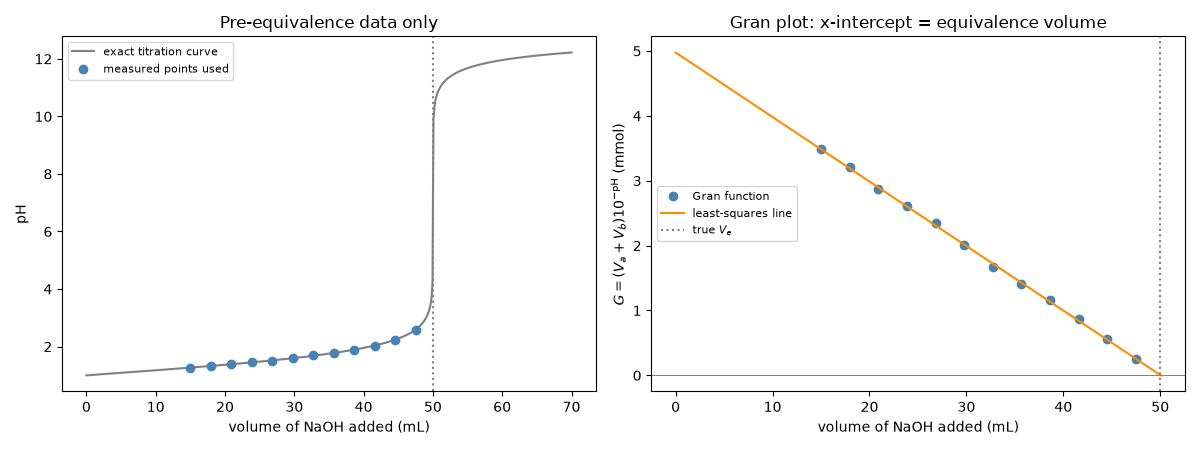
Recovered quantities – the slope is \(-C_b\) and the intercept is \(C_aV_a\):
print(f"Gran equivalence volume: {result.equivalence_volume * 1000:.3f} mL (true {Ve * 1000:.3f} mL)")
print(f"Slope = {result.slope:.4f} mol/L (-Cb = -0.1000); intercept = {result.intercept * 1000:.4f} mmol (CaVa = 5.0000)")

plt.show()
Gran equivalence volume: 50.049 mL (true 50.000 mL)
Slope = -0.0994 mol/L (-Cb = -0.1000); intercept = 4.9768 mmol (CaVa = 5.0000)
Total running time of the script: (0 minutes 0.073 seconds)