
Note
Go to the end to download the full example code.
Franck-Condon vibronic progressions in a UV-Vis absorption band#
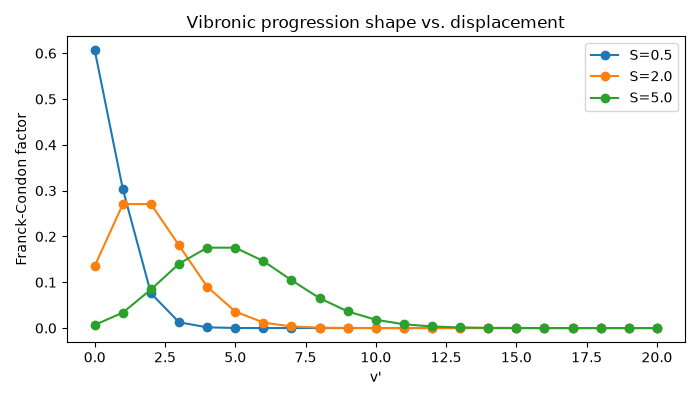
Builds a vibronic progression from the Huang-Rhys displacement parameter, verifies the Franck-Condon factors’ normalization (they must sum to 1 – the required correctness check for any Franck-Condon calculation), and shows how a larger excited-state displacement shifts the most-intense vibronic peak to higher v’.
import matplotlib.pyplot as plt
import numpy as np

from chemistrykit.spectro.systems.electronic import franck_condon_progression, franck_condon_spectrum, huang_rhys_factor
from chemistrykit.spectro.visualizers.spectro_plots import plot_broadened_spectrum, plot_stick_spectrum

# A displaced excited-state potential energy surface, characterized by
# the Huang-Rhys parameter S.
S = huang_rhys_factor(displacement=3.0e-11, mass=1.6e-27, angular_frequency=4.0e13)
print(f"Huang-Rhys parameter S = {S:.3f}")

progression = franck_condon_progression(v_max=25, S=S)
print(f"Sum of Franck-Condon factors (should be ~1): {np.sum(progression):.6f}")
print(f"Most probable transition: 0 -> {int(np.argmax(progression))} (S = {S:.2f})")
Huang-Rhys parameter S = 0.273
Sum of Franck-Condon factors (should be ~1): 1.000000
Most probable transition: 0 -> 0 (S = 0.27)
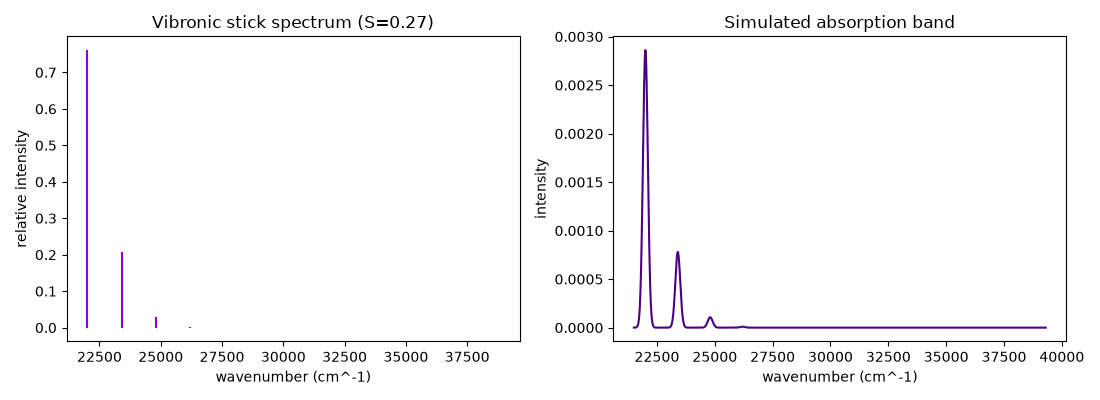
Building the full vibronic spectrum – stick positions at the electronic origin plus v’ quanta of excited-state vibrational spacing, stick heights the Franck-Condon factors:
spectrum = franck_condon_spectrum(origin_wavenumber=22000.0, vibrational_wavenumber=1400.0, S=S, v_max=12)

fig, (ax1, ax2) = plt.subplots(1, 2, figsize=(11, 4))
plot_stick_spectrum(spectrum, ax=ax1, color="darkviolet")
ax1.set_xlabel("wavenumber (cm^-1)")
ax1.set_title(f"Vibronic stick spectrum (S={S:.2f})")

x = np.linspace(spectrum.positions[0] - 500.0, spectrum.positions[-1] + 500.0, 2000)
plot_broadened_spectrum(spectrum, x, ax=ax2, shape="gaussian", fwhm=250.0, color="indigo")
ax2.set_xlabel("wavenumber (cm^-1)")
ax2.set_title("Simulated absorption band")

fig.tight_layout()
A larger displacement (bigger S) shifts the peak of the vibronic envelope to higher v’ and broadens the whole progression – the textbook signature of a large geometry change upon electronic excitation:
fig2, ax3 = plt.subplots(figsize=(7, 4))
for S_value in (0.5, 2.0, 5.0):
    prog = franck_condon_progression(v_max=20, S=S_value)
    ax3.plot(np.arange(len(prog)), prog, "o-", label=f"S={S_value}")
ax3.set_xlabel("v'")
ax3.set_ylabel("Franck-Condon factor")
ax3.set_title("Vibronic progression shape vs. displacement")
ax3.legend()
fig2.tight_layout()
plt.show()
Total running time of the script: (0 minutes 0.103 seconds)