
Note
Go to the end to download the full example code.
Pauling’s bond-order and bond-length correlation for carbon-carbon bonds#
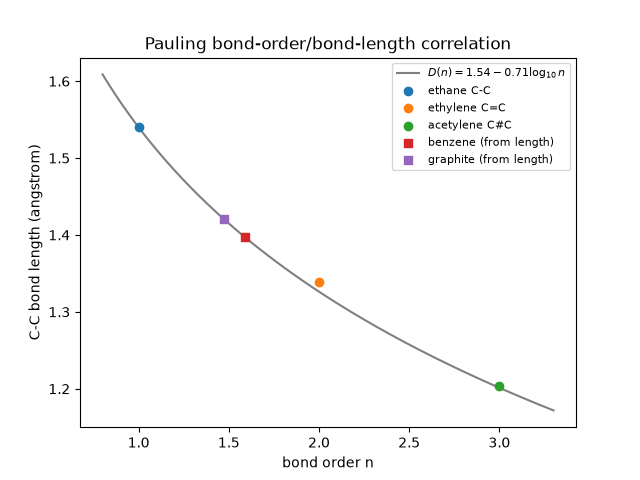
Linus Pauling (1947) related the length of a bond to its order,
with \(D(1) = 1.54\) Å the C-C single bond and \(c = 0.71\) Å for
carbon. The single, double and triple bonds of ethane, ethylene and
acetylene lie on the curve. Read backwards, it turns a measured length
into a bond order: benzene’s 1.397 Å bond and graphite’s 1.42 Å bond get
orders between 1 and 2. This example uses
bond_length_from_order() and
bond_order_from_length().
import matplotlib.pyplot as plt
import numpy as np

from chemistrykit.structure.systems.bonding import PAULING_C_C_CONSTANT, bond_length_from_order, bond_order_from_length
from chemistrykit.structure.visualizers.structure_plots import plot_bond_order_correlation

D1 = 1.54  # ethane C-C, angstrom
reference = {"ethane C-C": (1, 1.54), "ethylene C=C": (2, 1.339), "acetylene C#C": (3, 1.203)}
for name, (n, measured) in reference.items():
    predicted = bond_length_from_order(D1, n)
    print(f"{name:14s}: order {n}, predicted {predicted:.3f} A, measured {measured:.3f} A")
    assert abs(predicted - measured) < 0.02
ethane C-C    : order 1, predicted 1.540 A, measured 1.540 A
ethylene C=C  : order 2, predicted 1.326 A, measured 1.339 A
acetylene C#C : order 3, predicted 1.201 A, measured 1.203 A
Now read bond orders off measured lengths. Benzene’s comes out near 1.6, close to the 1 + 2/3 of Huckel-Coulson theory. Graphite, where each carbon shares one pi bond among three neighbours (order 4/3), comes out near 1.5: the ordering is right, but the correlation is empirical and only good to about 0.1 in bond order.
benzene  : 1.397 A -> bond order 1.59
graphite : 1.421 A -> bond order 1.47
ax = plot_bond_order_correlation(
    single_bond_length=D1, bond_orders=np.linspace(0.8, 3.3, 200), c=PAULING_C_C_CONSTANT, color="gray", label=r"$D(n) = 1.54 - 0.71\log_{10} n$"
)
for name, (n, measured) in reference.items():
    ax.scatter([n], [measured], zorder=3, label=name)
for name, n in estimated.items():
    ax.scatter([n], [unknown[name]], marker="s", zorder=3, label=f"{name} (from length)")
ax.set_ylabel("C-C bond length (angstrom)")
ax.legend(fontsize=8)
plt.show()
Total running time of the script: (0 minutes 0.040 seconds)