
Note
Go to the end to download the full example code.
The BET multilayer adsorption isotherm#
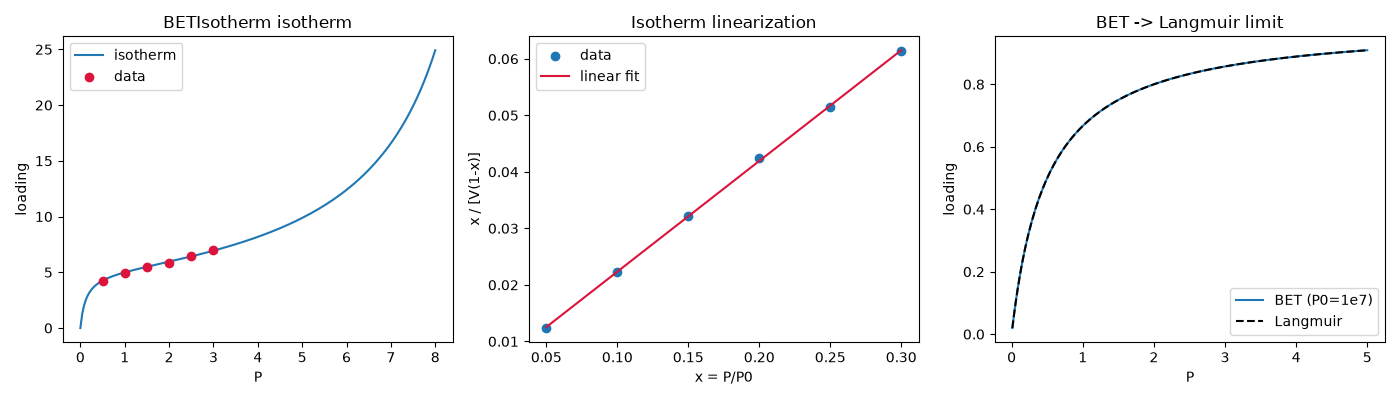
BETIsotherm generalizes
Langmuir to multilayer adsorption. As the saturation vapor pressure
\(P_0 \to \infty\) at fixed \(K=C/P_0\), multilayer condensation
is suppressed and BET reduces exactly to the Langmuir isotherm – a
reduction verified here numerically, not just asserted.
import matplotlib.pyplot as plt
import numpy as np

from chemistrykit.surface.systems.bet import BETIsotherm, fit_bet
from chemistrykit.surface.systems.langmuir import langmuir_coverage
from chemistrykit.surface.visualizers.surface_plots import plot_isotherm, plot_linearization

Vm_true, C_true, P0 = 5.0, 80.0, 10.0
iso = BETIsotherm(Vm=Vm_true, C=C_true, P0=P0)
Fit (Vm, C) from synthetic data restricted to the usual reliable BET range, 0.05 < P/P0 < 0.35.
rng = np.random.default_rng(2)
P_data = np.array([0.5, 1.0, 1.5, 2.0, 2.5, 3.0])
V_data = iso.loading(P_data) * (1.0 + rng.normal(scale=0.005, size=P_data.shape))

fit = fit_bet(P_data, V_data, P0=P0)
print(f"True (Vm, C)   = ({Vm_true}, {C_true})")
print(f"Fitted (Vm, C) = ({fit.Vm:.4f}, {fit.C:.4f})")
print(f"R^2 of linearized fit: {fit.r_squared:.6f}")
True (Vm, C)   = (5.0, 80.0)
Fitted (Vm, C) = (5.0341, 72.2212)
R^2 of linearized fit: 0.999704
The Langmuir-limit check: with P0 pushed far above the working pressure range (multilayer condensation never sets in), the BET curve should collapse onto the Langmuir isotherm with the same K=C/P0.
K = 2.0
P0_large = 1.0e7
C_large = K * P0_large
Vm = 1.0
P_scan = np.linspace(0.01, 5.0, 200)
V_bet = BETIsotherm(Vm=Vm, C=C_large, P0=P0_large).loading(P_scan)
theta_langmuir = langmuir_coverage(K, P_scan)
max_relative_error = np.max(np.abs(V_bet - Vm * theta_langmuir) / (Vm * theta_langmuir))
print(f"\nMax relative deviation of BET from Langmuir (P0/K=5e6): {max_relative_error:.2e}")
Max relative deviation of BET from Langmuir (P0/K=5e6): 5.45e-07
fig, axes = plt.subplots(1, 3, figsize=(14, 4))
plot_isotherm(iso, P_max=8.0, P_data=P_data, q_data=V_data, ax=axes[0])

x_lin = P_data / P0
y_lin = x_lin / (V_data * (1.0 - x_lin))
slope = (fit.C - 1.0) / (fit.Vm * fit.C)
intercept = 1.0 / (fit.Vm * fit.C)
plot_linearization(x_lin, y_lin, fit=(slope, intercept), ax=axes[1], xlabel="x = P/P0", ylabel="x / [V(1-x)]")

axes[2].plot(P_scan, V_bet, label="BET (P0=1e7)")
axes[2].plot(P_scan, Vm * theta_langmuir, "k--", label="Langmuir")
axes[2].set_xlabel("P")
axes[2].set_ylabel("loading")
axes[2].set_title("BET -> Langmuir limit")
axes[2].legend()
plt.tight_layout()
plt.show()
Total running time of the script: (0 minutes 0.093 seconds)