
Note
Go to the end to download the full example code.
Langmuir-Hinshelwood surface-reaction kinetics#
Single-site Langmuir-Hinshelwood kinetics
(lh_rate_single_site())
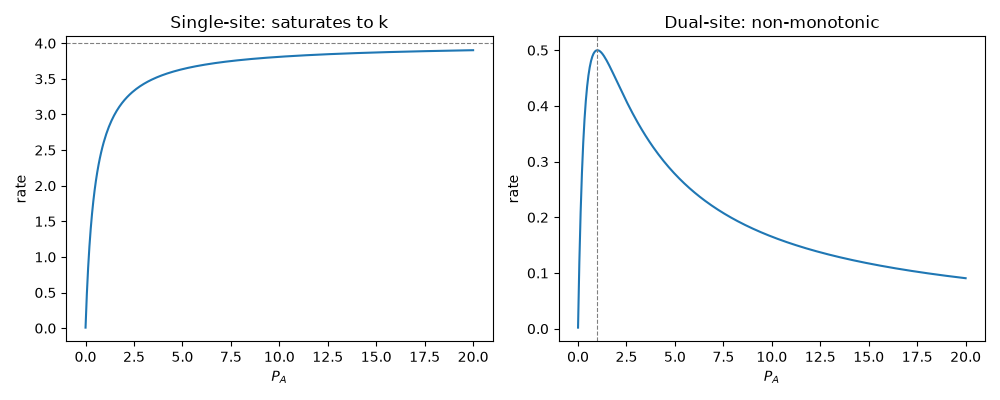
transitions from first order (low pressure) to zero order (surface
saturated) in the reactant’s pressure. Dual-site kinetics
(lh_rate_dual_site())
– competitive adsorption of two reactants on the same sites – shows the
characteristic non-monotonic rate-vs-pressure behavior: too much of one
reactant crowds the other off the surface entirely.
import matplotlib.pyplot as plt
import numpy as np

from chemistrykit.surface.systems.langmuir_hinshelwood import lh_rate_dual_site, lh_rate_single_site
from chemistrykit.surface.visualizers.surface_plots import plot_lh_rate_vs_pressure

k, K_A = 4.0, 2.0
P_A = np.linspace(0.001, 20.0, 300)
rate_single = lh_rate_single_site(k, K_A, P_A)

print(f"Rate at half-saturation pressure P_A=1/K_A: {lh_rate_single_site(k, K_A, 1.0 / K_A):.4f} (should be k/2 = {k / 2:.4f})")
print(f"Rate at very high pressure: {lh_rate_single_site(k, K_A, 1.0e6):.4f} (should saturate to k = {k})")
Rate at half-saturation pressure P_A=1/K_A: 2.0000 (should be k/2 = 2.0000)
Rate at very high pressure: 4.0000 (should saturate to k = 4.0)
Dual-site kinetics: fix P_B and scan P_A. The rate rises, peaks, then falls as A crowds B off the surface.
Dual-site rate peaks at P_A = 1.0043
fig, axes = plt.subplots(1, 2, figsize=(10, 4))
plot_lh_rate_vs_pressure(P_A, rate_single, ax=axes[0])
axes[0].axhline(k, color="gray", linestyle="--", linewidth=0.8)
axes[0].set_title("Single-site: saturates to k")

plot_lh_rate_vs_pressure(P_A, rate_dual, ax=axes[1])
axes[1].axvline(P_A[peak_idx], color="gray", linestyle="--", linewidth=0.8)
axes[1].set_title("Dual-site: non-monotonic")
plt.tight_layout()
plt.show()
Total running time of the script: (0 minutes 0.059 seconds)