
Note
Go to the end to download the full example code.
The Temkin isotherm: a heat of adsorption that falls with coverage#
Temkin and Pyzhev (1940), modelling ammonia synthesis on iron, dropped
Langmuir’s single site energy. In their picture the heat of adsorption
falls linearly as the surface fills, which is the same as a uniform
spread of site energies of width \(fRT\). Averaging the Langmuir
coverage over that spread
(uniform_energy_coverage())
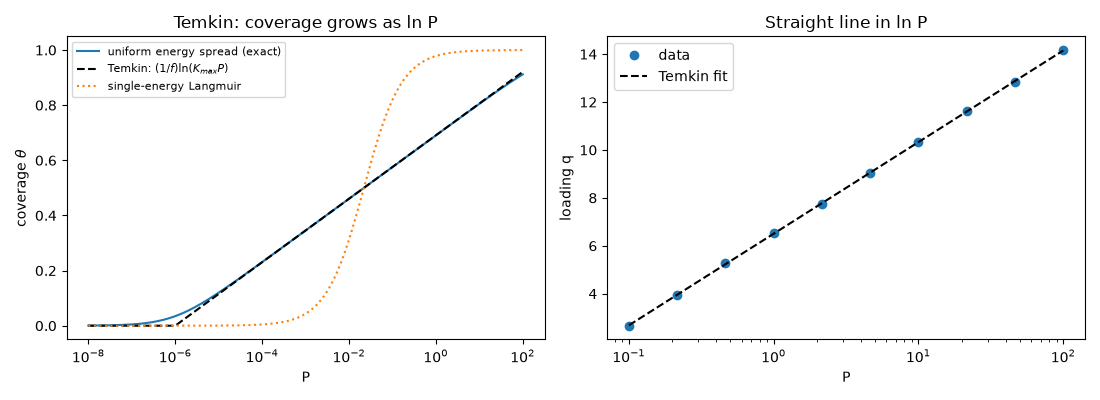
gives an isotherm that is logarithmic over a wide middle range of
coverage, \(\theta \approx (1/f)\ln(K_{max}P)\), the Temkin form. A
single Langmuir curve covers only about two decades of pressure, while
the Temkin curve rises steadily over many. Loading data in that range is
a straight line in \(\ln P\), which
fit_temkin() fits.
import matplotlib.pyplot as plt
import numpy as np

from chemistrykit.surface.systems.langmuir import langmuir_coverage
from chemistrykit.surface.systems.temkin import fit_temkin, temkin_loading, uniform_energy_coverage

K_max, f = 1.0e6, 20.0
P = np.logspace(-8, 2, 400)
theta_temkin = uniform_energy_coverage(K_max, f, P)
theta_log = np.log(K_max * P) / f
theta_langmuir = langmuir_coverage(K_max * np.exp(-f / 2), P)

mid = (theta_temkin > 0.2) & (theta_temkin < 0.8)
print(f"Max |exact - (1/f) ln(K_max P)| for 0.2 < theta < 0.8: {np.max(np.abs(theta_temkin - theta_log)[mid]):.2e}")
Max |exact - (1/f) ln(K_max P)| for 0.2 < theta < 0.8: 9.13e-04
Fit the loading form q = (RT/b_T) ln(A_T P) to noisy middle-coverage data.
T, A_T, b_T = 300.0, 50.0, 1500.0
rng = np.random.default_rng(4)
P_data = np.logspace(-1, 2, 10)
q_data = temkin_loading(A_T, b_T, P_data, T) + rng.normal(scale=0.02, size=P_data.shape)
fit = fit_temkin(P_data, q_data, T)
print(f"True   (A_T, b_T) = ({A_T}, {b_T})")
print(f"Fitted (A_T, b_T) = ({fit.A_T:.2f}, {fit.b_T:.1f}), R^2 = {fit.r_squared:.5f}")
True   (A_T, b_T) = (50.0, 1500.0)
Fitted (A_T, b_T) = (50.16, 1501.7), R^2 = 0.99997
fig, axes = plt.subplots(1, 2, figsize=(11, 4))
axes[0].semilogx(P, theta_temkin, label="uniform energy spread (exact)")
axes[0].semilogx(P, np.clip(theta_log, 0, 1), "k--", label=r"Temkin: $(1/f)\ln(K_{max}P)$")
axes[0].semilogx(P, theta_langmuir, ":", label="single-energy Langmuir")
axes[0].set_xlabel("P")
axes[0].set_ylabel(r"coverage $\theta$")
axes[0].set_title("Temkin: coverage grows as ln P")
axes[0].legend(fontsize=8)

axes[1].semilogx(P_data, q_data, "o", label="data")
P_fine = np.logspace(-1, 2, 100)
axes[1].semilogx(P_fine, temkin_loading(fit.A_T, fit.b_T, P_fine, T), "k--", label="Temkin fit")
axes[1].set_xlabel("P")
axes[1].set_ylabel("loading q")
axes[1].set_title("Straight line in ln P")
axes[1].legend()
plt.tight_layout()
plt.show()
Total running time of the script: (0 minutes 0.088 seconds)