
Note
Go to the end to download the full example code.
The Oregonator: oscillations of the Belousov-Zhabotinsky reaction#
Field and Noyes (1974) boiled the FKN mechanism of the Belousov-Zhabotinsky
(BZ) reaction – cerium-catalyzed oxidation of malonic acid by bromate –
down to three intermediates: HBrO2 (x), bromide (y), and the
oxidized catalyst Ce(IV) (z). The resulting “Oregonator”
(Oregonator) produces
the BZ reaction’s hallmark relaxation oscillations: long quiet stretches
while bromide is slowly consumed, then an autocatalytic burst of HBrO2
that oxidizes the catalyst (the colour flash seen by Belousov), which in
turn regenerates bromide and shuts the burst off. Raising the
stoichiometric factor \(f\) well above 2 stabilizes the steady state
and the oscillation disappears.
import matplotlib.pyplot as plt
import numpy as np

from chemistrykit.kinetics.systems.oscillators import Oregonator

oscillating = Oregonator(f=1.0)
result = oscillating.integrate((0.0, 40.0), method="dopri5", rtol=1e-7, atol=1e-10, max_steps=2_000_000)
x, y, z = result.y.T

fig, axes = plt.subplots(1, 3, figsize=(16, 4.5))
for series, label, color in [(x, "x = [HBrO2] (scaled)", "steelblue"), (y, "y = [Br-] (scaled)", "darkorange"), (z, "z = [Ce(IV)] (scaled)", "seagreen")]:
    axes[0].semilogy(result.t, series, label=label, color=color)
axes[0].set_xlabel("t (scaled)")
axes[0].set_ylabel("concentration (log scale)")
axes[0].set_title("Relaxation oscillations, f = 1")
axes[0].legend(fontsize=8)

late = result.t > 10.0
axes[1].loglog(x[late], z[late], color="steelblue", label="limit cycle")
axes[1].loglog(*oscillating.fixed_point()[[0, 2]], "k*", markersize=12, label="unstable steady state")
axes[1].set_xlabel("x")
axes[1].set_ylabel("z")
axes[1].set_title("Phase portrait: a stable limit cycle")
axes[1].legend()
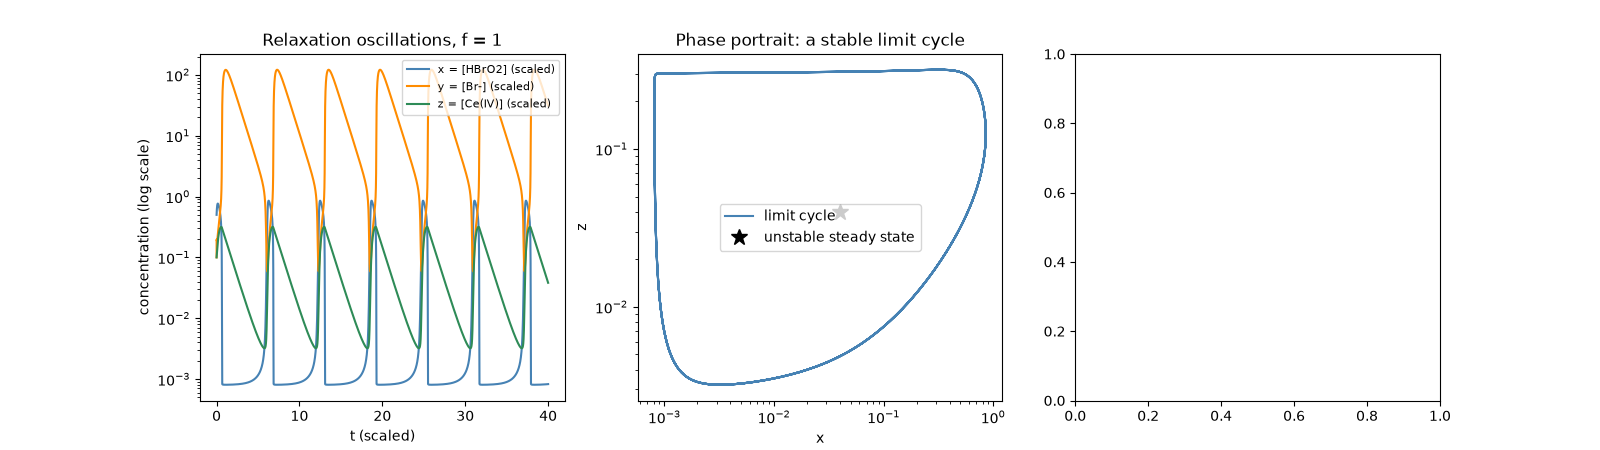
<matplotlib.legend.Legend object at 0x11c778440>
Period estimate from successive HBrO2 spikes.
7 spikes; mean period = 6.209 (scaled time units)
With f = 3 the same mechanism simply relaxes to its steady state.
stable = Oregonator(f=3.0)
res_stable = stable.integrate((0.0, 40.0), method="dopri5", rtol=1e-7, atol=1e-10, max_steps=2_000_000)
axes[2].semilogy(res_stable.t, res_stable.y[:, 0], color="steelblue", label="x, f = 3")
axes[2].axhline(stable.fixed_point()[0], color="gray", linestyle="--", label="steady state x*")
axes[2].set_xlabel("t (scaled)")
axes[2].set_ylabel("x")
axes[2].set_title("No oscillation for f = 3")
axes[2].legend()

fig.tight_layout()
plt.show()
Total running time of the script: (0 minutes 0.628 seconds)