
Note
Go to the end to download the full example code.
Nuclear magnetic resonance: Larmor frequencies and the field-independent chemical shift#
Bloch and Purcell (1946) showed that nuclei in a static field
\(B_0\) absorb radio-frequency energy sharply at the Larmor
frequency \(\nu_0=\gamma B_0/(2\pi)\). The effect became a chemical
tool when it was found that a nucleus’s surrounding electrons shield it
slightly, so the exact resonance frequency depends on its chemical
environment. This example computes
\(^1\mathrm{H}\) and \(^{13}\mathrm{C}\) Larmor frequencies
against field strength. It then places three proton environments of
methyl acetate-like shielding on the frequency axis at two field
strengths and shows that converting to ppm with
chemical_shift_ppm() makes the
spectrum field-independent.
import matplotlib.pyplot as plt
import numpy as np
import scipy.constants as sc

from chemistrykit.spectro.systems.nmr import chemical_shift_ppm, larmor_frequency

gamma_h = sc.physical_constants["proton gyromag. ratio"][0]  # rad s^-1 T^-1
gamma_c13 = 6.728284e7  # rad s^-1 T^-1, carbon-13

for field in (1.41, 7.05, 9.40, 14.1, 23.5):
    print(f"B0 = {field:5.2f} T: 1H {larmor_frequency(gamma_h, field) / 1e6:7.1f} MHz, 13C {larmor_frequency(gamma_c13, field) / 1e6:6.1f} MHz")
B0 =  1.41 T: 1H    60.0 MHz, 13C   15.1 MHz
B0 =  7.05 T: 1H   300.2 MHz, 13C   75.5 MHz
B0 =  9.40 T: 1H   400.2 MHz, 13C  100.7 MHz
B0 = 14.10 T: 1H   600.3 MHz, 13C  151.0 MHz
B0 = 23.50 T: 1H  1000.6 MHz, 13C  251.6 MHz
Chemical shielding: each proton environment resonates at \(\nu=\nu_\text{ref}(1+\delta\times10^{-6})\), where \(\nu_\text{ref}\) is the TMS reference frequency. In Hz the separations grow with the field. In ppm they do not.
shifts_true = {"CH3-C(=O)": 2.05, "O-CH3": 3.67, "TMS": 0.0}
fig, axes = plt.subplots(2, 2, figsize=(11, 6))
for row, field in enumerate((7.05, 14.1)):
    ref = larmor_frequency(gamma_h, field)
    freqs = {name: ref * (1.0 + d * 1e-6) for name, d in shifts_true.items()}
    offsets_hz = np.array([f - ref for f in freqs.values()])
    ppm = chemical_shift_ppm(np.array(list(freqs.values())), ref)
    print(f"{ref / 1e6:.0f} MHz: offsets from TMS {np.round(offsets_hz, 1)} Hz -> {np.round(ppm, 3)} ppm")

    axes[row, 0].vlines(offsets_hz, 0.0, [3, 3, 1], color="tab:blue", lw=2)
    axes[row, 0].set_xlim(2500.0, -200.0)
    axes[row, 0].set_title(f"{ref / 1e6:.0f} MHz: offset in Hz")
    axes[row, 0].set_xlabel("frequency above TMS (Hz)")
    axes[row, 1].vlines(ppm, 0.0, [3, 3, 1], color="tab:green", lw=2)
    axes[row, 1].set_xlim(4.5, -0.5)
    axes[row, 1].set_title(f"{ref / 1e6:.0f} MHz: chemical shift in ppm")
    axes[row, 1].set_xlabel(r"$\delta$ (ppm)")
    for name, d in shifts_true.items():
        axes[row, 1].annotate(name, (d, 3.1 if name != "TMS" else 1.1), ha="center", fontsize=8)
    for ax in axes[row]:
        ax.set_ylim(0.0, 3.8)
        ax.set_yticks([])
fig.suptitle("NMR resonance: Hz separations scale with B0, chemical shifts do not")
fig.tight_layout()
plt.show()
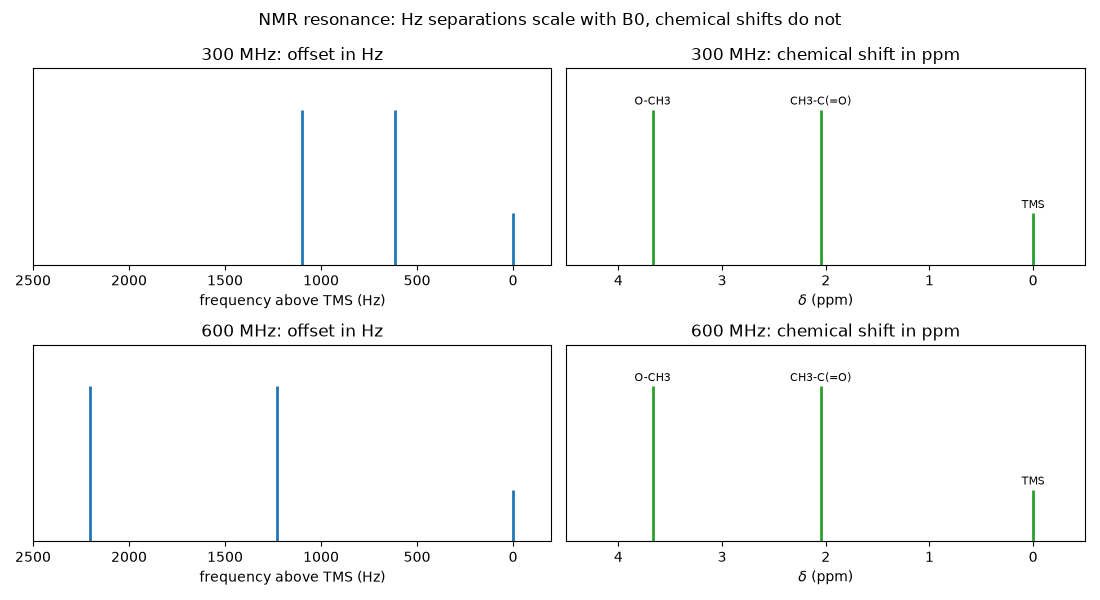
300 MHz: offsets from TMS [ 615.4 1101.6    0. ] Hz -> [2.05 3.67 0.  ] ppm
600 MHz: offsets from TMS [1230.7 2203.3    0. ] Hz -> [2.05 3.67 0.  ] ppm
Total running time of the script: (0 minutes 0.066 seconds)