
Note
Go to the end to download the full example code.
Langmuir’s adsorption isotherm from a lattice-gas model#
Irving Langmuir’s 1918 picture of adsorption: a fixed number of
independent, non-interacting surface sites, each either empty or holding
exactly one molecule with binding energy \(\epsilon\).
LatticeGasAdsorption treats those sites in
equilibrium with an ideal-gas reservoir and recovers exactly the Langmuir
isotherm \(\theta=P/(P+P_0)\) – linear in P at low pressure,
saturating at a full monolayer at high pressure – shown here for two
binding strengths.
import matplotlib.pyplot as plt
import numpy as np

from chemistrykit.statmech import LatticeGasAdsorption

nitrogen_mass = 28.0 * 1.66053906660e-27  # kg

weak = LatticeGasAdsorption(adsorption_energy=1.5e-20, mass=nitrogen_mass, T=298.15)
strong = LatticeGasAdsorption(adsorption_energy=4.0e-20, mass=nitrogen_mass, T=298.15)

P = np.logspace(2, 10, 300)

fig, axes = plt.subplots(1, 2, figsize=(11, 4.5))
for model, label, color in [(weak, "weak binding", "steelblue"), (strong, "strong binding", "crimson")]:
    P0 = model.p_half()
    axes[0].plot(P, model.coverage(P), color=color, label=f"{label} (P0 = {P0:.2e} Pa)")
    axes[1].plot(P / P0, model.coverage(P), color=color, label=label)
axes[0].set_xscale("log")
axes[0].axhline(0.5, color="gray", linestyle=":", linewidth=0.8)
axes[0].set_xlabel("P (Pa)")
axes[0].set_ylabel(r"coverage $\theta$")
axes[0].set_title("Langmuir isotherms")
axes[0].legend()

# On the reduced pressure axis P/P0 every Langmuir isotherm collapses onto
# the same curve, theta = x / (1 + x), with initial slope 1 (Henry's-law
# regime) and saturation at theta = 1:
x = np.linspace(0.0, 10.0, 200)
axes[1].plot(x, x, color="gray", linestyle="--", linewidth=0.8, label=r"low-$P$ limit $\theta = P/P_0$")
axes[1].axhline(1.0, color="gray", linestyle=":", linewidth=0.8, label="full monolayer")
axes[1].set_xlim(0.0, 10.0)
axes[1].set_ylim(0.0, 1.1)
axes[1].set_xlabel("P / P0")
axes[1].set_ylabel(r"coverage $\theta$")
axes[1].set_title("Universal Langmuir form")
axes[1].legend()
fig.tight_layout()

plt.show()
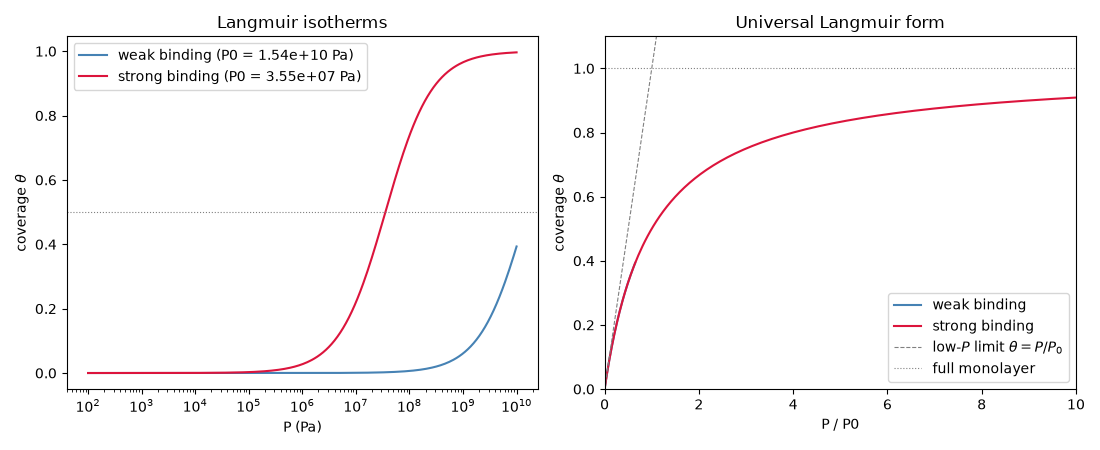
Stronger binding shifts the isotherm to lower pressure (saturation is
reached “more easily” when adsorption is more favorable) – exactly
what p_half() predicts
from the adsorption energy alone:
weak   binding: P0 = 1.543e+10 Pa, theta(1 bar) = 0.0000
strong binding: P0 = 3.554e+07 Pa, theta(1 bar) = 0.0028
Total running time of the script: (0 minutes 0.115 seconds)