
Note
Go to the end to download the full example code.
Pauling’s electronegativity scale from bond energies#
Linus Pauling (1932) noticed that a bond A-B is usually stronger than the average of the A-A and B-B bonds. He called the excess the extra ionic energy,
and defined the electronegativity difference by
\(|\chi_A - \chi_B| = \sqrt{\Delta / \mathrm{eV}}\). This example
applies
pauling_electronegativity_difference()
to textbook bond dissociation energies for the hydrogen halides and a few
other bonds, compares the result with the tabulated Pauling values in
chemistrykit.periodic_table, and plots the scale across the first
rows of the periodic table.
import matplotlib.pyplot as plt

from chemistrykit.periodic_table import electronegativity, get_element
from chemistrykit.structure.systems.bonding import pauling_electronegativity_difference

# Mean bond dissociation energies, kJ/mol (standard textbook values).
homonuclear = {"H": 436.0, "F": 158.0, "Cl": 242.0, "Br": 193.0, "I": 151.0, "C": 346.0}
heteronuclear = {
    ("H", "F"): 568.0,
    ("H", "Cl"): 432.0,
    ("H", "Br"): 366.0,
    ("H", "I"): 298.0,
    ("C", "H"): 413.0,
    ("Cl", "F"): 253.0,
}

rows = []
for (a, b), d_ab in heteronuclear.items():
    from_energy = pauling_electronegativity_difference(d_ab, homonuclear[a], homonuclear[b])
    tabulated = abs(electronegativity(a) - electronegativity(b))
    rows.append((f"{a}-{b}", from_energy, tabulated))
    print(f"{a}-{b:2s}: extra ionic energy -> |dchi| = {from_energy:.2f}   tabulated Pauling |dchi| = {tabulated:.2f}")
H-F : extra ionic energy -> |dchi| = 1.68   tabulated Pauling |dchi| = 1.78
H-Cl: extra ionic energy -> |dchi| = 0.98   tabulated Pauling |dchi| = 0.96
H-Br: extra ionic energy -> |dchi| = 0.73   tabulated Pauling |dchi| = 0.76
H-I : extra ionic energy -> |dchi| = 0.22   tabulated Pauling |dchi| = 0.46
C-H : extra ionic energy -> |dchi| = 0.48   tabulated Pauling |dchi| = 0.35
Cl-F : extra ionic energy -> |dchi| = 0.74   tabulated Pauling |dchi| = 0.82
The agreement is close for the strongly polar H-F and H-Cl bonds and rough for weakly polar ones, where the extra ionic energy is a small difference of large numbers. Pauling later refined the scale with more data (and the geometric mean), but its ordering already appears here: F > Cl > Br > I.
fig, (ax1, ax2) = plt.subplots(1, 2, figsize=(11, 4))
labels = [r[0] for r in rows]
x = range(len(rows))
ax1.bar([i - 0.2 for i in x], [r[1] for r in rows], width=0.4, label="from bond energies")
ax1.bar([i + 0.2 for i in x], [r[2] for r in rows], width=0.4, label="Pauling table")
ax1.set_xticks(list(x), labels)
ax1.set_ylabel(r"$|\chi_A - \chi_B|$")
ax1.set_title("Electronegativity difference from extra ionic energy")
ax1.legend()

for period, symbols in {
    2: ["Li", "Be", "B", "C", "N", "O", "F"],
    3: ["Na", "Mg", "Al", "Si", "P", "S", "Cl"],
    4: ["K", "Ca", "Ga", "Ge", "As", "Se", "Br"],
}.items():
    ax2.plot(range(1, 8), [electronegativity(s) for s in symbols], marker="o", label=f"period {period}")
    for k, s in enumerate(symbols, start=1):
        ax2.annotate(s, (k, electronegativity(s)), textcoords="offset points", xytext=(0, 5), fontsize=7, ha="center")
ax2.set_xticks(range(1, 8), [f"group {g}" for g in (1, 2, 13, 14, 15, 16, 17)], rotation=30)
ax2.set_ylabel(r"Pauling electronegativity $\chi$")
ax2.set_title("The Pauling scale rises across each period")
ax2.legend()
fig.tight_layout()
print(f"\nMost electronegative element tabulated: F (Z={get_element('F').atomic_number}), chi = {electronegativity('F')}")
plt.show()
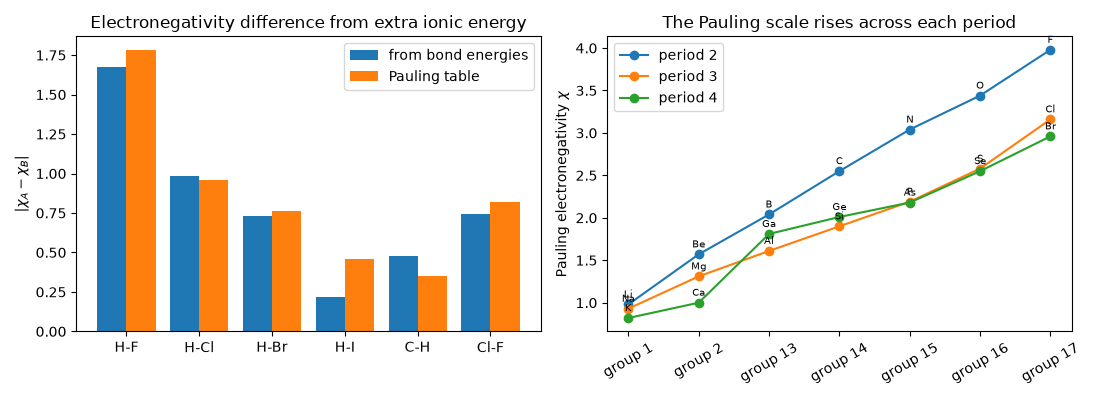
Most electronegative element tabulated: F (Z=9), chi = 3.98
Total running time of the script: (0 minutes 0.095 seconds)