
Note
Go to the end to download the full example code.
Boudart’s turnover frequency: comparing catalysts per active site#
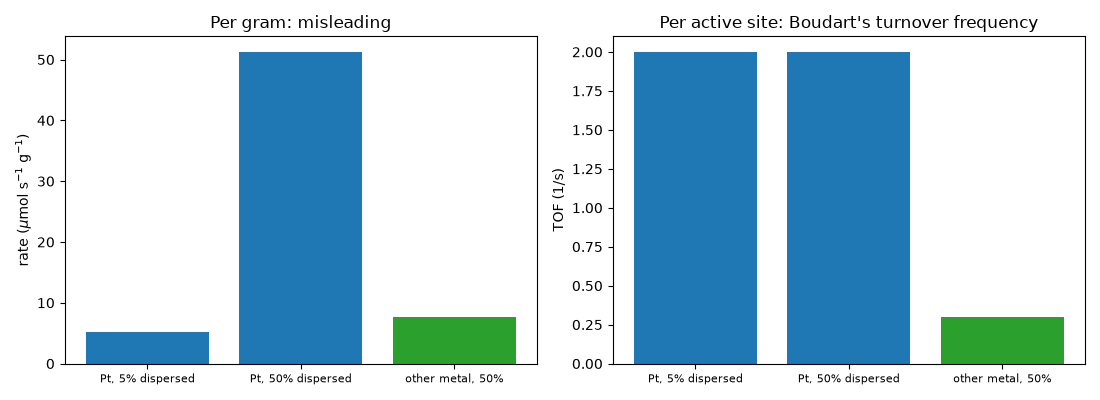
Boudart argued that catalysts should be compared by their rate per
active site, the turnover frequency
(turnover_frequency()), and
not by their rate per gram. Below, two samples of the same supported
platinum differ only in dispersion, the fraction of Pt atoms exposed at
the surface. The well-dispersed sample looks ten times more active per
gram, yet both have the same TOF, because each exposed site works
equally hard. A third, genuinely different metal does show a different
TOF. The turnover_number()
gives the complementary lifetime measure of total cycles per site.
import matplotlib.pyplot as plt
import numpy as np

from chemistrykit.surface.systems.catalysis import turnover_frequency, turnover_number

M_Pt = 195.08e-3  # kg/mol
loading = 0.01  # 1 wt% metal on support
samples = {
    "Pt, 5% dispersed": (0.05, 2.0),  # (dispersion, TOF of the metal in 1/s)
    "Pt, 50% dispersed": (0.50, 2.0),
    "other metal, 50%": (0.50, 0.3),
}

names, rate_per_gram, tofs = [], [], []
for name, (dispersion, intrinsic_tof) in samples.items():
    sites_per_gram = loading / (M_Pt * 1e3) * dispersion  # mol surface sites per g catalyst
    rate = intrinsic_tof * sites_per_gram  # mol/s per g, what a reactor measures
    tof = turnover_frequency(rate, sites_per_gram)
    names.append(name)
    rate_per_gram.append(rate)
    tofs.append(tof)
    print(f"{name:18s} rate = {rate:.3e} mol/(s g)   TOF = {tof:.2f} 1/s")
Pt, 5% dispersed   rate = 5.126e-06 mol/(s g)   TOF = 2.00 1/s
Pt, 50% dispersed  rate = 5.126e-05 mol/(s g)   TOF = 2.00 1/s
other metal, 50%   rate = 7.689e-06 mol/(s g)   TOF = 0.30 1/s
Turnover number: total cycles per site over a 10-hour run of the well-dispersed Pt sample.
TON after 10 h: 72000 cycles per site
fig, axes = plt.subplots(1, 2, figsize=(11, 4))
x = np.arange(len(names))
axes[0].bar(x, np.array(rate_per_gram) * 1e6, color=["C0", "C0", "C2"])
axes[0].set_xticks(x, names, fontsize=8)
axes[0].set_ylabel(r"rate ($\mu$mol s$^{-1}$ g$^{-1}$)")
axes[0].set_title("Per gram: misleading")
axes[1].bar(x, tofs, color=["C0", "C0", "C2"])
axes[1].set_xticks(x, names, fontsize=8)
axes[1].set_ylabel("TOF (1/s)")
axes[1].set_title("Per active site: Boudart's turnover frequency")
plt.tight_layout()
plt.show()
Total running time of the script: (0 minutes 0.055 seconds)