
Note
Go to the end to download the full example code.
Lewis fugacity: the effective pressure of a real gas#
G. N. Lewis replaced pressure by the fugacity \(f = \phi P\) so that
the ideal-gas form \(\mu = \mu^\circ + RT\ln(f/P^\circ)\) stays exact
for real fluids. The left panel shows the fugacity coefficient
\(\phi\) of supercritical CO2 computed by
fugacity_coefficient() from
three equations of state. The right panel shows Lewis’s phase-equilibrium
criterion: below \(T_c\) the liquid and vapor fugacities from
fugacity() cross exactly at
the saturation pressure.
import matplotlib.pyplot as plt
import numpy as np

from chemistrykit.thermo.systems.equations_of_state import PengRobinson, RedlichKwong, VanDerWaals
from chemistrykit.thermo.systems.fugacity import fugacity, fugacity_coefficient, saturation_pressure

Tc, Pc = 304.13, 7.3773e6  # CO2
pr = PengRobinson(Tc, Pc, omega=0.224)
models = {"Peng-Robinson": pr, "Redlich-Kwong": RedlichKwong.from_critical_constants(Tc, Pc), "van der Waals": VanDerWaals.from_critical_constants(Tc, Pc)}

fig, axes = plt.subplots(1, 2, figsize=(12, 4.8))
P = np.linspace(0.1e6, 30e6, 120)
T = 350.0
for name, eos in models.items():
    axes[0].plot(P / 1e6, [fugacity_coefficient(eos, p, T) for p in P], label=name)
axes[0].axhline(1.0, color="gray", linestyle=":", label="ideal gas")
axes[0].set_xlabel("P (MPa)")
axes[0].set_ylabel(r"fugacity coefficient $\phi = f/P$")
axes[0].set_title(f"CO2 at {T:.0f} K (supercritical)")
axes[0].legend()
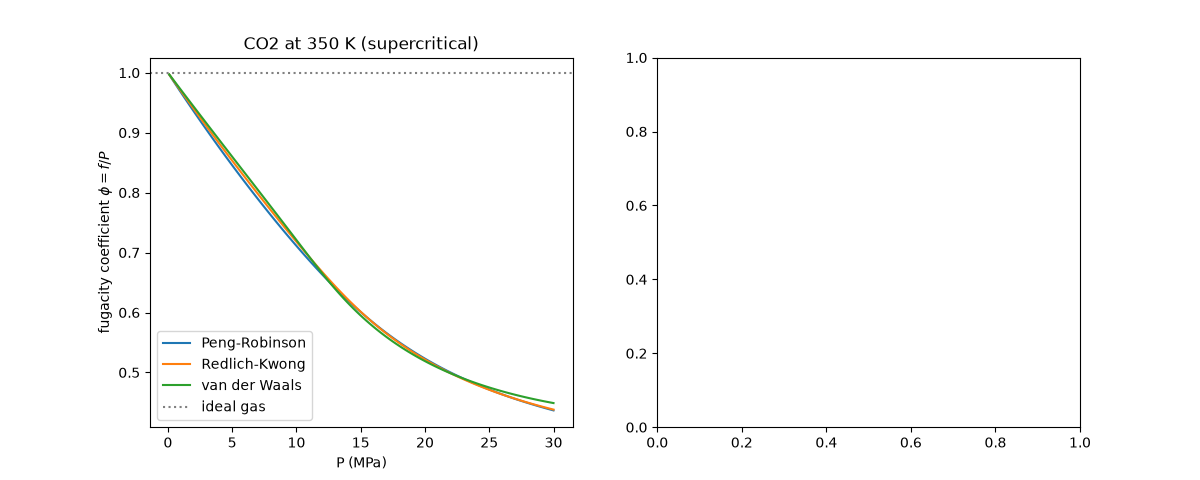
<matplotlib.legend.Legend object at 0x11a59a270>
Below the critical temperature, the vapor and liquid roots coexist over a range of pressures; Lewis’s criterion picks the one where \(f^L = f^V\).
T_sub = 280.0
P_sat = saturation_pressure(pr, T_sub)
P_range = np.linspace(0.75 * P_sat, 1.2 * P_sat, 80)
f_vap = [fugacity(pr, p, T_sub, "vapor") for p in P_range]
f_liq = [fugacity(pr, p, T_sub, "liquid") for p in P_range]
axes[1].plot(P_range / 1e6, np.array(f_vap) / 1e6, label="vapor root")
axes[1].plot(P_range / 1e6, np.array(f_liq) / 1e6, label="liquid root")
axes[1].axvline(P_sat / 1e6, color="crimson", linestyle="--", label=f"f(liquid) = f(vapor): {P_sat / 1e6:.2f} MPa")
axes[1].set_xlabel("P (MPa)")
axes[1].set_ylabel("fugacity f (MPa)")
axes[1].set_title(f"Peng-Robinson CO2 at {T_sub:.0f} K")
axes[1].legend()
fig.tight_layout()

print(f"Peng-Robinson saturation pressure of CO2 at {T_sub:.0f} K: {P_sat / 1e6:.3f} MPa (measured: about 4.16 MPa)")
print(f"phi at saturation: {fugacity_coefficient(pr, P_sat, T_sub):.3f}")

plt.show()
Peng-Robinson saturation pressure of CO2 at 280 K: 4.160 MPa (measured: about 4.16 MPa)
phi at saturation: 0.736
Total running time of the script: (0 minutes 0.073 seconds)