
Note
Go to the end to download the full example code.
Wilson’s local-composition model: the ethanol-water azeotrope#
Wilson’s 1964 model (WilsonSolution)
assumes each molecule’s immediate neighborhood differs in composition
from the bulk, weighted by Boltzmann factors of the interaction
energies. With just two parameters it describes strongly non-ideal
miscible mixtures. Below, at 70 degC, pure-component vapor pressures come
from Antoine’s equation (NIST constants), and Wilson parameters of the
size fitted to ethanol-water data give the familiar maximum-pressure
azeotrope near 90 mol% ethanol. That azeotrope is why ordinary
distillation cannot purify ethanol past about 95 wt%.
import matplotlib.pyplot as plt
import numpy as np

from chemistrykit.thermo import AntoineEquation, BinaryIdealSolution, WilsonSolution

T = 343.15
P_ethanol = float(AntoineEquation(5.37229, 1670.409, -40.191).pressure(T)) * 100.0  # kPa
P_water = float(AntoineEquation(5.08354, 1663.125, -45.622).pressure(T)) * 100.0

mix = WilsonSolution(Lambda12=0.1782, Lambda21=0.8703, P1_star=P_ethanol, P2_star=P_water)
ideal = BinaryIdealSolution(P_A_star=P_ethanol, P_B_star=P_water)
x_az, P_az = mix.azeotrope()

x = np.linspace(0.0, 1.0, 400)
fig, axes = plt.subplots(1, 2, figsize=(12, 4.8))
axes[0].plot(x, mix.total_pressure(x), color="darkorange", label="bubble curve (liquid x)")
axes[0].plot(mix.vapor_composition(x), mix.total_pressure(x), color="steelblue", label="dew curve (vapor y)")
axes[0].plot(x, ideal.total_pressure(x), ":", color="gray", label="Raoult's law")
axes[0].plot([x_az], [P_az], "ko", label=f"azeotrope, x = {x_az:.3f}")
axes[0].set_xlabel("mole fraction of ethanol")
axes[0].set_ylabel("pressure (kPa)")
axes[0].set_title("Ethanol-water P-x-y diagram at 70 degC (Wilson)")
axes[0].legend()

g1, g2 = mix.activity_coefficients(x)
axes[1].plot(x, np.log(g1), color="darkorange", label=r"$\ln\gamma_{ethanol}$")
axes[1].plot(x, np.log(g2), color="steelblue", label=r"$\ln\gamma_{water}$")
axes[1].set_xlabel("mole fraction of ethanol")
axes[1].set_ylabel(r"$\ln\gamma$")
axes[1].set_title("Wilson activity coefficients")
axes[1].legend()
fig.tight_layout()
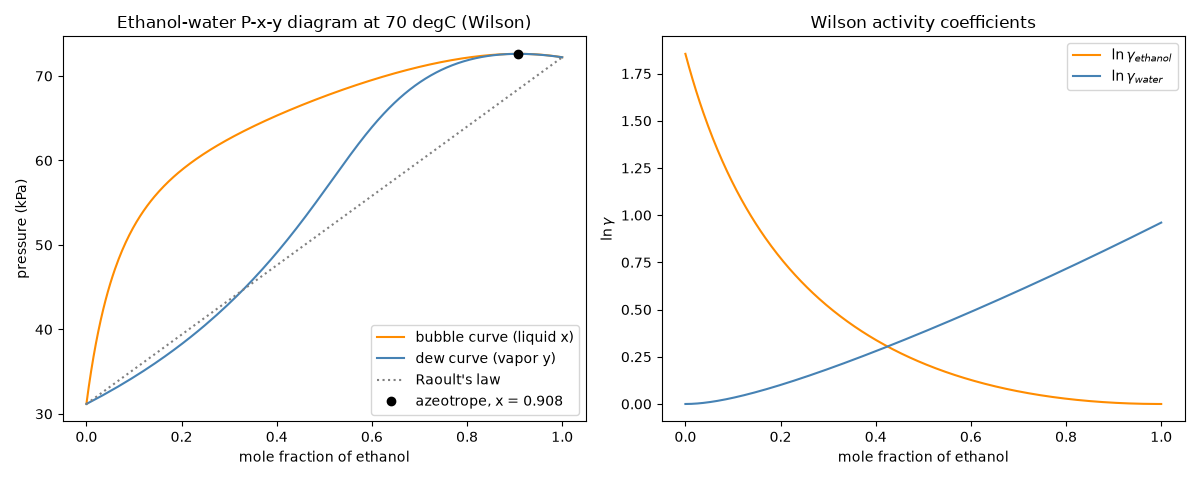
azeotrope: x_ethanol = 0.908 at P = 72.6 kPa
relative volatility at x = 0.5: 1.96
relative volatility at x = 0.95: 0.95  (< 1: water is now the more volatile)
Total running time of the script: (0 minutes 0.087 seconds)