
Note
Go to the end to download the full example code.
Rossler Attractor#
The Rossler system is three coupled nonlinear autonomous ODEs, deliberately designed to be simpler than Lorenz while still chaotic:
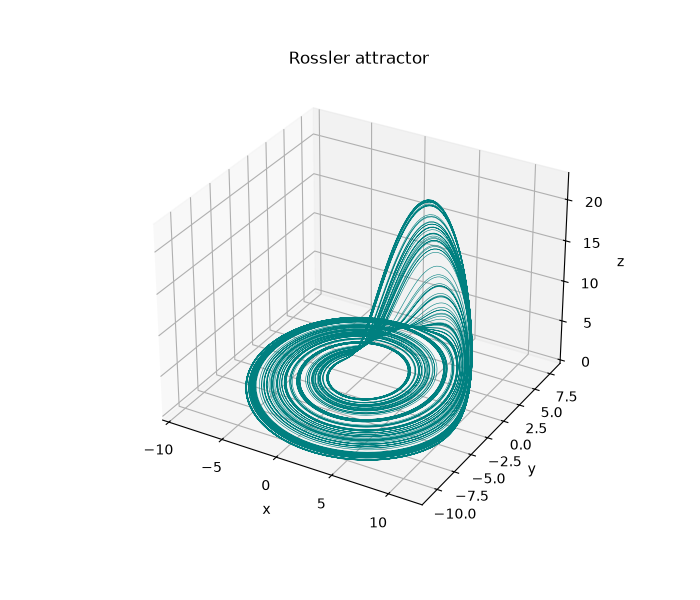
It produces a simpler-looking, ribbon-like strange attractor than Lorenz,
built from a single stretch-and-fold mechanism: trajectories spiral
outward in the \((x, y)\) plane (driven by the linear \(-y-z\) and
\(x+ay\) terms) until \(x\) exceeds \(c\), at which point the
\(z (x - c)\) term kicks the trajectory up and folds it back down onto
the spiral. This example integrates a trajectory with
physicskit.chaos.systems.continuous.Rossler.trajectory() and plots it
in 3D, using the classic chaotic parameters \(a=0.2\), \(b=0.2\),
\(c=5.7\).
Integrate#
Plot#
Poincare section: the stretch-and-fold mechanism, laid bare#
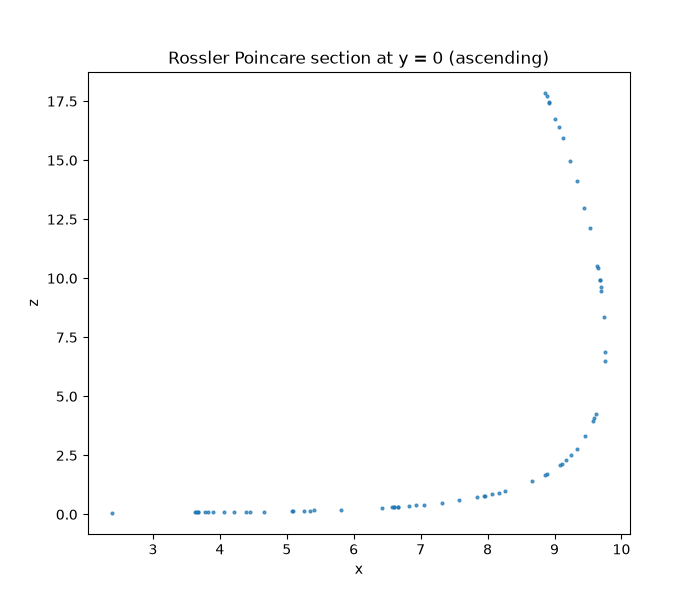
Sampling the flow only at the instants it crosses the plane \(y = 0\) moving outward (\(\dot{y} > 0\)) – the natural section for a spiral that winds around the \(z\)-axis – turns the ribbon-like 3D attractor into a near-one-dimensional curve of successive crossings’ \((x, z)\). That the points collapse almost onto a single folded curve (rather than filling a 2D patch) is the direct visual signature of the single stretch-and-fold mechanism described above: each pass around the spiral maps an interval of \(x\) values into a slightly different, folded-over interval, iteration after iteration.
fig2, ax2 = plot_poincare_map(
    system,
    system.initial_state(),
    coord=1,
    value=0.0,
    direction=1.0,
    plot_coords=(0, 2),
    t_max=400.0,
    dt=0.005,
    s=4,
)
ax2.set_xlabel("x")
ax2.set_ylabel("z")
ax2.set_title("Rossler Poincare section at y = 0 (ascending)")

plt.show()
Check#
Rossler’s band: bounded spiralling in x, y with rare large spikes in z.
Total running time of the script: (0 minutes 0.083 seconds)