Interactive and Animated Visualizers#
Examples illustrating the dynamic visualizers in
physicskit.chaos.visualizers.dynamic_plots: a live Matplotlib animation of a
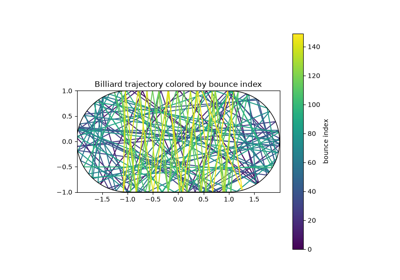
billiard trajectory alongside its growing Poincare section, interactive
Plotly figures (2D and 3D), and trajectory color-coding.
Note
Run directly (python examples/.../plot_x.py), the Matplotlib animation
opens an interactive window and the Plotly figures open in a browser tab.
In the built documentation, the animation is instead embedded as inline
HTML5 video (via Sphinx-Gallery’s
animation scraper,
enabled by matplotlib_animations: True in docs/source/conf.py) and
the Plotly figures as interactive embedded charts (via
plotly.io._sg_scraper.plotly_sg_scraper, Plotly’s own Sphinx-Gallery
scraper).