
Note
Go to the end to download the full example code.
Cronin and Fitch: CP violation in neutral kaon decay#
CP symmetry predicted that the long-lived neutral kaon \(K_L\),
being CP-odd, could never decay to two pions, a CP-even final state. In
1964 Cronin and Fitch found that it does, about twice in every thousand
decays. The weak interaction is not symmetric under CP. This example
models the neutral kaon as the two-state mixing problem implemented by
meson_decay_rates_cp_eigenstate(),
first with \(\varepsilon=0\) and then with the measured
\(|\varepsilon|\approx2.2\times10^{-3}\), and computes the
\(K^0\)/\(\bar K^0\) decay-rate asymmetry
cp_asymmetry() from which the
violation is measured.
import matplotlib.pyplot as plt
import numpy as np

from physicskit.particle.electroweak import cp_asymmetry, meson_decay_rates_cp_eigenstate
from physicskit.particle.visualizers import animate_cp_asymmetry
The two neutral-kaon lifetimes#
K_short and K_long decay at very different rates; times are in units of the K_S lifetime here.
No CP violation: identical K0 and K0-bar decay rates#
gamma_meson_0, gamma_mesonbar_0 = meson_decay_rates_cp_eigenstate(t, delta_m, gamma_s, gamma_l, epsilon=0.0)
print(f"epsilon=0 (CP conserved): max |Gamma(K0) - Gamma(K0bar)| = {np.max(np.abs(gamma_meson_0 - gamma_mesonbar_0)):.2e} (identical, as CP demands)")
epsilon=0 (CP conserved): max |Gamma(K0) - Gamma(K0bar)| = 0.00e+00 (identical, as CP demands)
Cronin and Fitch’s actual result: a small but real CP-violating admixture#
The real K0 system’s CP-violation parameter is tiny, \(|\epsilon| \sim 2.2\times10^{-3}\).
epsilon = 2.2e-3 * np.exp(1j * np.radians(43.5))  # the real K0 system's measured |epsilon| and phase
gamma_meson, gamma_mesonbar = meson_decay_rates_cp_eigenstate(t, delta_m, gamma_s, gamma_l, epsilon)
A = cp_asymmetry(t, delta_m, gamma_s, gamma_l, epsilon)

print(f"epsilon={abs(epsilon):.4f} (Cronin-Fitch's actual result): decay rates now genuinely differ")
print(f"asymmetry A(t): oscillates with amplitude up to {np.max(np.abs(A)):.4f}, inside a decaying envelope")

fig, (ax1, ax2) = plt.subplots(1, 2, figsize=(11, 4.2))
ax1.semilogy(t, gamma_meson, color="steelblue", label=r"$\Gamma(K^0\to f)$")
ax1.semilogy(t, gamma_mesonbar, color="firebrick", label=r"$\Gamma(\bar K^0\to f)$")
ax1.set_xlabel(r"proper time $t$ (units of $1/\Gamma_S$)")
ax1.set_ylabel("decay rate to a CP eigenstate")
ax1.set_title("K0 vs K0-bar decay rates: nearly, but not exactly, equal")
ax1.legend(fontsize=8)

ax2.plot(t, A, color="darkorange")
ax2.axhline(0, color="0.6", lw=0.8)
ax2.set_xlabel(r"proper time $t$ (units of $1/\Gamma_S$)")
ax2.set_ylabel("CP asymmetry A(t)")
ax2.set_title(r"A nonzero asymmetry: CP violation, $\varepsilon\neq0$")
fig.tight_layout()
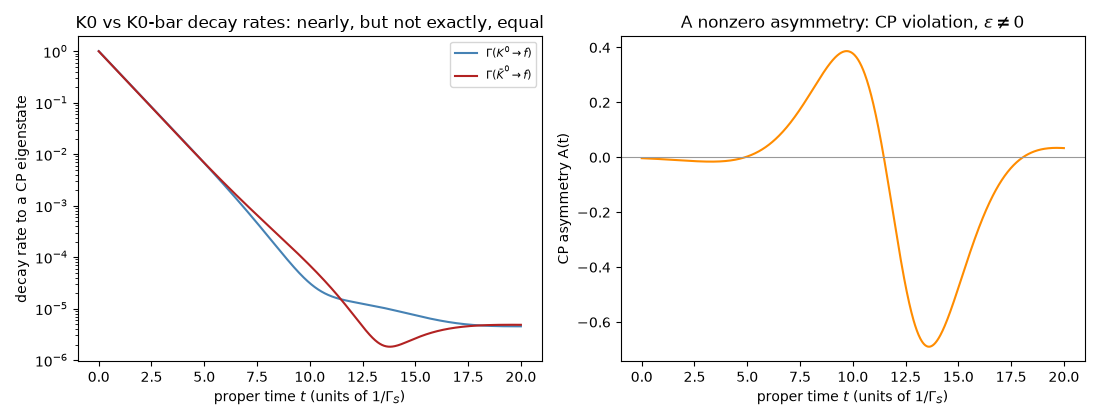
epsilon=0.0022 (Cronin-Fitch's actual result): decay rates now genuinely differ
asymmetry A(t): oscillates with amplitude up to 0.6897, inside a decaying envelope
Building up the measured asymmetry over time#
Check#
With epsilon = 0 the K0 and K0-bar rates coincide; with the measured epsilon the asymmetry starts at 2 Re(epsilon) and peaks where the K_S and K_L amplitudes interfere, around 12-15 K_S lifetimes.
assert np.max(np.abs(gamma_meson_0 - gamma_mesonbar_0)) == 0
assert abs(abs(A[0]) - 2 * epsilon.real) < 1e-6
assert 10 < t[np.argmax(np.abs(A))] < 16
Total running time of the script: (0 minutes 42.305 seconds)