
Note
Go to the end to download the full example code.
Becquerel’s discovery: uranium rays on a photographic plate#
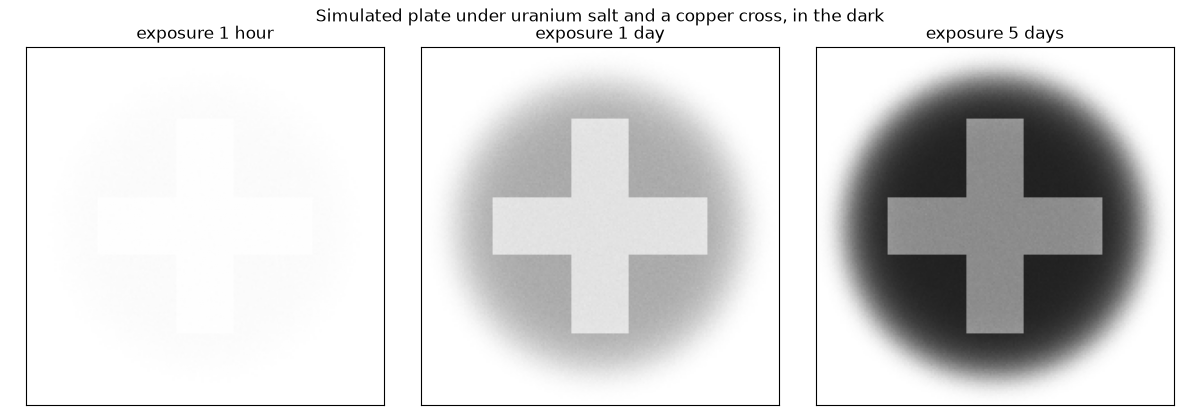
In February 1896 Henri Becquerel, testing whether phosphorescent salts emit X-rays after exposure to sunlight, left a uranium salt on a plate wrapped in black paper, with a copper cross in between, in a drawer during several overcast days. When he developed it the plate was strongly darkened, showing the cross in silhouette. The salt had not been in the sun. The emission came from the uranium itself, needed no excitation, and did not fade.
This example estimates the salt’s activity with
decay_constant() and
activity(), builds a simulated plate
from the individual decays, and contrasts the steady “uranium rays”
with the phosphorescence Becquerel expected, which fades within hours.
How active is a gram of uranium salt?#
Potassium uranyl sulfate, \(\mathrm{K_2UO_2(SO_4)_2\cdot2H_2O}\), has one uranium atom per 576 g/mol. Uranium-238’s half-life is 4.47 billion years. Its short-lived daughters (thorium-234, protactinium-234m) are in equilibrium with it and emit the beta rays that pass through black paper; each decays as often as the uranium does.
mass_g, molar_mass = 1.0, 576.0
N_U238 = 0.9927 * mass_g / molar_mass * AVOGADRO
lam = decay_constant(4.468e9 * YEAR)
A_U238 = activity(N_U238, lam)
beta_rate = 2 * A_U238  # Th-234 and Pa-234m betas, in secular equilibrium
print(f"U-238 atoms in 1 g of salt: {N_U238:.2e}")
print(f"U-238 activity:             {A_U238:,.0f} decays per second")
print(f"beta emissions (daughters): {beta_rate:,.0f} per second")

exposure = 5 * 24 * 3600.0  # five overcast days in the drawer
decays = beta_rate * exposure
fading = 1 - radioactive_decay_number(1.0, lam, exposure)
print(f"betas emitted in 5 days:    {decays:.2e}")
print(f"fractional drop in activity over those 5 days: {fading:.1e}  -- effectively constant")
U-238 atoms in 1 g of salt: 1.04e+21
U-238 activity:             5,102 decays per second
beta emissions (daughters): 10,204 per second
betas emitted in 5 days:    4.41e+09
fractional drop in activity over those 5 days: 2.1e-12  -- effectively constant
The plate#
Assume 2% of the betas cross the paper into the emulsion (the rest go the wrong way or stop in the salt) and spread them over a 4 x 4 cm plate under the crystals. The copper cross absorbs about 70% of them. Each grain is a Poisson count; darkening follows the count.
rng = np.random.default_rng(1896)
n_px = 200
yy, xx = np.mgrid[-1 : 1 : n_px * 1j, -1 : 1 : n_px * 1j]
salt = np.exp(-((np.hypot(xx, yy) / 0.8) ** 8))  # the crystals' footprint
arm = 0.16
cross = ((np.abs(xx) < arm) & (np.abs(yy) < 0.6)) | ((np.abs(yy) < arm) & (np.abs(xx) < 0.6))
transmission = np.where(cross, 0.3, 1.0)

hits_per_px = 0.02 * decays / salt.sum()


def develop(t_exposure):
    counts = rng.poisson(hits_per_px * (t_exposure / exposure) * salt * transmission)
    return 1 - np.exp(-counts / (0.5 * hits_per_px))  # saturating optical density


fig1, axes = plt.subplots(1, 3, figsize=(12, 4.2))
for ax, (label, t) in zip(axes, [("1 hour", 3600.0), ("1 day", 86400.0), ("5 days", exposure)]):
    ax.imshow(develop(t), cmap="gray_r", vmin=0, vmax=1)
    ax.set_title(f"exposure {label}")
    ax.set_xticks([])
    ax.set_yticks([])
fig1.suptitle("Simulated plate under uranium salt and a copper cross, in the dark")
fig1.tight_layout()
Phosphorescence fades; uranium rays do not#
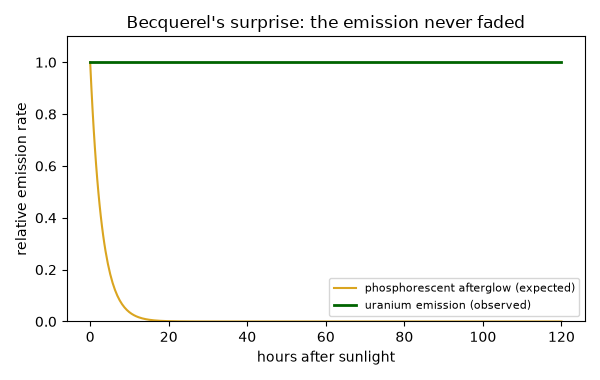
Becquerel expected the emission to be phosphorescence excited by sunlight, which dies away over hours. Instead the salt kept exposing plates for weeks, with or without light – and so did non-phosphorescent uranium compounds and uranium metal.
t_h = np.linspace(0, 120, 400)
phosphorescence = np.exp(-t_h / 3.0)  # illustrative afterglow, 3-hour decay
uranium = radioactive_decay_number(1.0, lam, t_h * 3600.0)

fig2, ax2 = plt.subplots(figsize=(6, 3.8))
ax2.plot(t_h, phosphorescence, color="goldenrod", label="phosphorescent afterglow (expected)")
ax2.plot(t_h, uranium, color="darkgreen", lw=2, label="uranium emission (observed)")
ax2.set_xlabel("hours after sunlight")
ax2.set_ylabel("relative emission rate")
ax2.set_ylim(0, 1.1)
ax2.set_title("Becquerel's surprise: the emission never faded")
ax2.legend(fontsize=8)
fig2.tight_layout()

plt.show()
Check#
U-238’s specific activity is 12.4 kBq per gram of uranium; at a 4.5-Gyr half-life the activity does not change over the exposure.
Total running time of the script: (0 minutes 0.103 seconds)