
Note
Go to the end to download the full example code.
The Pandey-Mehta GOE-GUE Crossover#
The Pandey-Mehta crossover ensemble interpolates continuously between time-reversal-symmetric (GOE, \(\beta=1\)) and time-reversal-broken (GUE, \(\beta=2\)) level statistics via a single real parameter \(\lambda\):
where \(A\) is an independent real symmetric (GOE-type) matrix and \(B\) is an independent real antisymmetric matrix, so that \(i\lambda B\) is Hermitian and \(H(\lambda)\) is Hermitian for any real \(\lambda\). At \(\lambda=0\), \(H = A\) recovers GOE exactly; as \(\lambda\) grows, the antisymmetric imaginary part breaks time-reversal symmetry, and the raw eigenvalue spread grows as \(\sqrt{n(1+\lambda^2)}\).
This example reproduces the Pandey-Mehta crossover ensemble \(H(\lambda) = A + i\lambda B\): as the time-reversal-breaking parameter \(\lambda\) grows from 0, the consecutive-spacing-ratio statistic (which needs no unfolding) moves continuously away from the GOE surmise and toward the GUE surmise – the first quantitative demonstration that “how broken” a symmetry is can be read directly off spectral statistics.
Reference: A. Pandey, M. L. Mehta, Commun. Math. Phys. 87 (1982) 449.
- Run:
python examples/paper_replications/goe_gue_crossover_demo.py
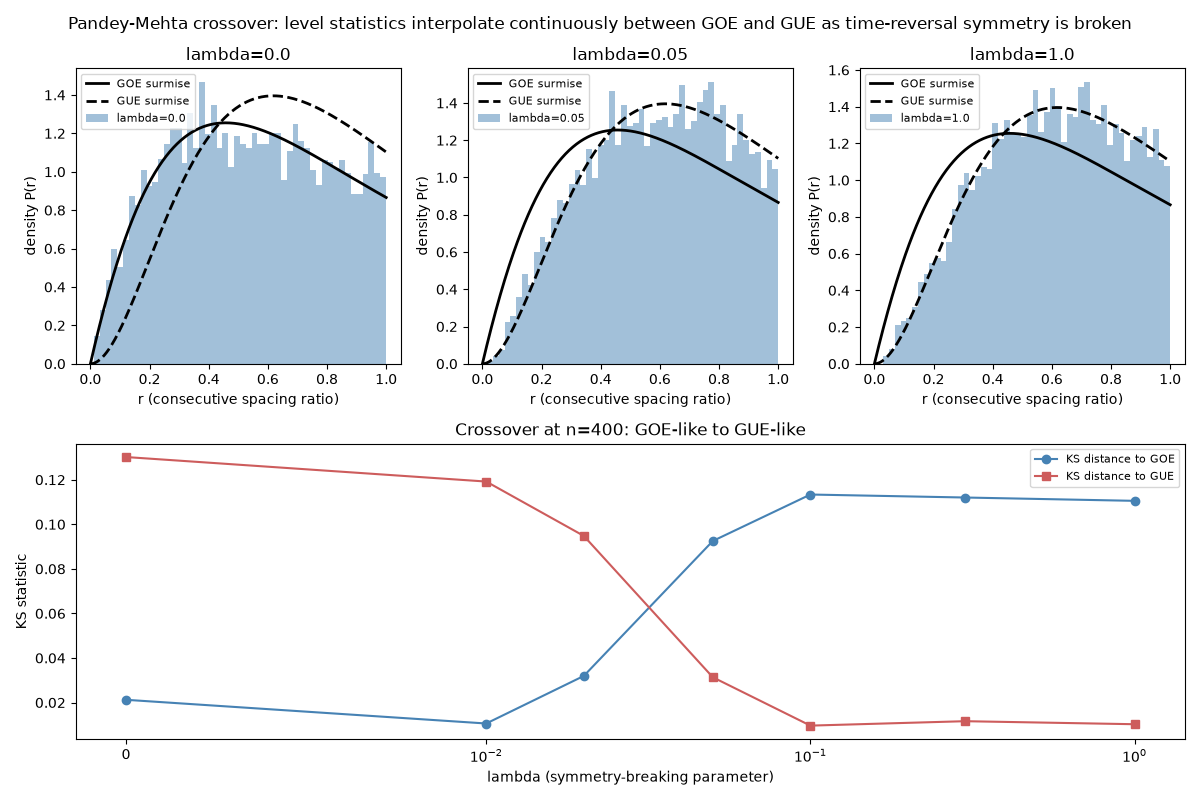
Saved goe_gue_crossover_replication.png
import matplotlib.pyplot as plt
import numpy as np
from scipy.stats import kstest

import physicskit.rmt as rmt

N = 400
N_SAMPLES = 20
SEED = 2026

goe_surmise = rmt.stats.RatioSurmise(beta=1)
gue_surmise = rmt.stats.RatioSurmise(beta=2)

fig, axd = plt.subplot_mosaic(
    [["l1", "l2", "l3"], ["ks", "ks", "ks"]],
    figsize=(12, 8),
)

# --- Panels "l1"-"l3": ratio-statistic histograms at three lambda values ---
r_grid = np.linspace(0, 1, 400)

for lam, key in zip([0.0, 0.05, 1.0], ["l1", "l2", "l3"], strict=True):
    ens = rmt.ensembles.GOEGUECrossoverEnsemble(n=N, lam=lam, seed=SEED)
    spectrum = ens.sample(n_samples=N_SAMPLES)
    ratios = rmt.stats.ratio_statistics(spectrum)
    ax = axd[key]
    ax.plot(r_grid, goe_surmise.pdf(r_grid), "k-", lw=2, label="GOE surmise")
    ax.plot(r_grid, gue_surmise.pdf(r_grid), "k--", lw=2, label="GUE surmise")
    ax.hist(ratios, bins=50, density=True, alpha=0.5, color="steelblue", label=f"lambda={lam}")
    ax.set_xlabel("r (consecutive spacing ratio)")
    ax.set_ylabel("density P(r)")
    ax.set_title(f"lambda={lam}")
    ax.legend(fontsize=8)

# --- Panel "ks": KS distance to GOE/GUE surmises vs. lambda ---
lambdas = np.array([0.0, 0.01, 0.02, 0.05, 0.1, 0.3, 1.0])
ks_goe = []
ks_gue = []
for lam in lambdas:
    ens = rmt.ensembles.GOEGUECrossoverEnsemble(n=N, lam=float(lam), seed=SEED + 1)
    spectrum = ens.sample(n_samples=N_SAMPLES)
    ratios = rmt.stats.ratio_statistics(spectrum)
    ks_goe.append(kstest(ratios, goe_surmise.cdf).statistic)
    ks_gue.append(kstest(ratios, gue_surmise.cdf).statistic)

ax = axd["ks"]
ax.plot(lambdas, ks_goe, "o-", color="steelblue", label="KS distance to GOE")
ax.plot(lambdas, ks_gue, "s-", color="indianred", label="KS distance to GUE")
ax.set_xscale("symlog", linthresh=0.01)
ax.set_xlabel("lambda (symmetry-breaking parameter)")
ax.set_ylabel("KS statistic")
ax.set_title(f"Crossover at n={N}: GOE-like to GUE-like")
ax.legend(fontsize=8)

fig.suptitle(
    "Pandey-Mehta crossover: level statistics interpolate continuously between GOE and GUE as time-reversal symmetry is broken",
)
fig.tight_layout()
out_path = "goe_gue_crossover_replication.png"
fig.savefig(out_path, dpi=150)
print(f"Saved {out_path}")
Total running time of the script: (0 minutes 2.630 seconds)