
Note
Go to the end to download the full example code.
Percolation: a purely geometric phase transition#
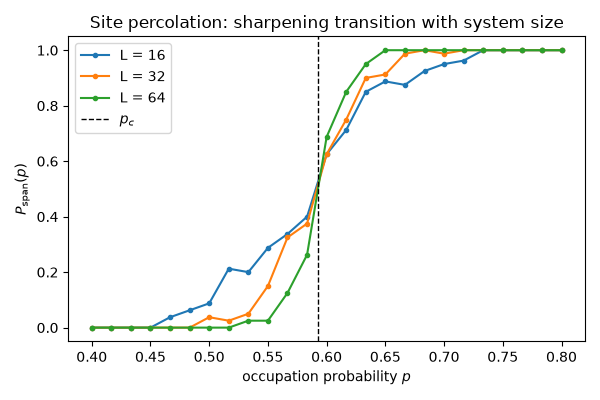
Percolation theory shows that a sharp, universal phase transition does not require energy, temperature, or even dynamics – pure geometry suffices. As the occupation probability \(p\) of a random lattice increases past a critical threshold \(p_c\), an infinite spanning cluster suddenly appears. This example uses Hoshen-Kopelman cluster labeling to estimate the spanning probability curve \(P_{\text{span}}(p)\) for site percolation on the square lattice (\(p_c \approx 0.593\)), and visualizes the fractal, self-similar spanning cluster right at criticality.
import matplotlib.pyplot as plt
import numpy as np

from physicskit.statphys.chapters.percolation import Percolation2D
from physicskit.statphys.visualizers.lattice_render import (
    plot_cluster_size_distribution,
    plot_percolation_clusters,
)
The spanning probability curve sharpens with system size#
plt.figure(figsize=(6, 4))
p_values = np.linspace(0.4, 0.8, 25)
for L in [16, 32, 64]:
    perc = Percolation2D(L=L, mode="site", seed=0)
    p, P_span = perc.spanning_probability(p_values, n_trials=80)
    plt.plot(p, P_span, marker="o", ms=3, label=f"L = {L}")
plt.axvline(Percolation2D.P_C_SITE, color="k", linestyle="--", linewidth=1, label="$p_c$")
plt.xlabel("occupation probability $p$")
plt.ylabel("$P_{\\mathrm{span}}(p)$")
plt.title("Site percolation: sharpening transition with system size")
plt.legend()
plt.tight_layout()
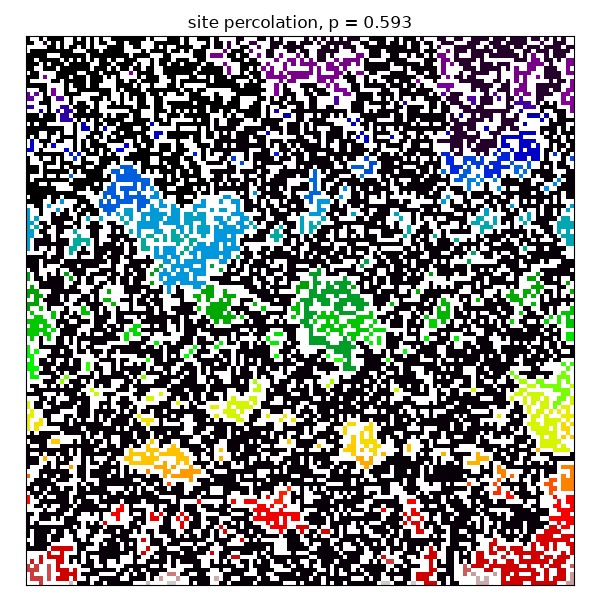
The spanning cluster at criticality is a fractal#
At p_c the largest cluster’s mass grows as M ~ L^{d_f} with d_f < 2: it fills a vanishing fraction of an ever larger lattice. The slope of log M against log L over several sizes gives d_f.
L_mass = np.array([32, 64, 128, 256])
M_largest = []
for L in L_mass:
    perc = Percolation2D(L=int(L), mode="site", seed=2)
    masses = []
    for _trial in range(30):
        perc.generate(Percolation2D.P_C_SITE)
        masses.append(perc.cluster_size_distribution().max())
    M_largest.append(np.mean(masses))
d_f = np.polyfit(np.log(L_mass), np.log(M_largest), 1)[0]
print(f"Fractal dimension from M ~ L^d_f at p_c: {d_f:.3f} (theory: 91/48 = {91 / 48:.3f})")

perc = Percolation2D(L=128, p=Percolation2D.P_C_SITE, mode="site", seed=1)

fig, ax = plt.subplots(figsize=(6, 6))
plot_percolation_clusters(perc, ax=ax)
plt.tight_layout()
Fractal dimension from M ~ L^d_f at p_c: 1.872 (theory: 91/48 = 1.896)
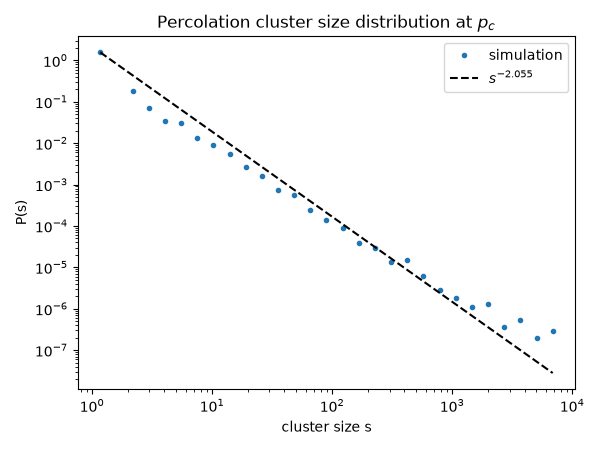
Cluster sizes follow a power law at criticality#
Away from p_c, the cluster size distribution has a well-defined characteristic scale and falls off exponentially; exactly at p_c, that scale diverges and n_s ~ s^{-tau} instead, with the Fisher exponent tau = 187/91 for 2D percolation – the geometric analogue of a diverging susceptibility at a thermal critical point.
all_sizes = []
for _trial in range(20):
    perc.generate(Percolation2D.P_C_SITE)
    all_sizes.append(perc.cluster_size_distribution())
all_sizes = np.concatenate(all_sizes)

fig, ax = plt.subplots(figsize=(6, 4.5))
plot_cluster_size_distribution(all_sizes, ax=ax)
ax.set_title("Percolation cluster size distribution at $p_c$")
plt.tight_layout()
plt.show()
Check#
No spanning far below p_c, certain spanning far above; d_f = 91/48.
Total running time of the script: (0 minutes 6.357 seconds)