
Note
Go to the end to download the full example code.
The Kosterlitz-Thouless transition: vortex-antivortex unbinding#
The 2D XY model places a planar spin angle \(\theta_i \in [0,2\pi)\) on every site of a periodic lattice, with Hamiltonian
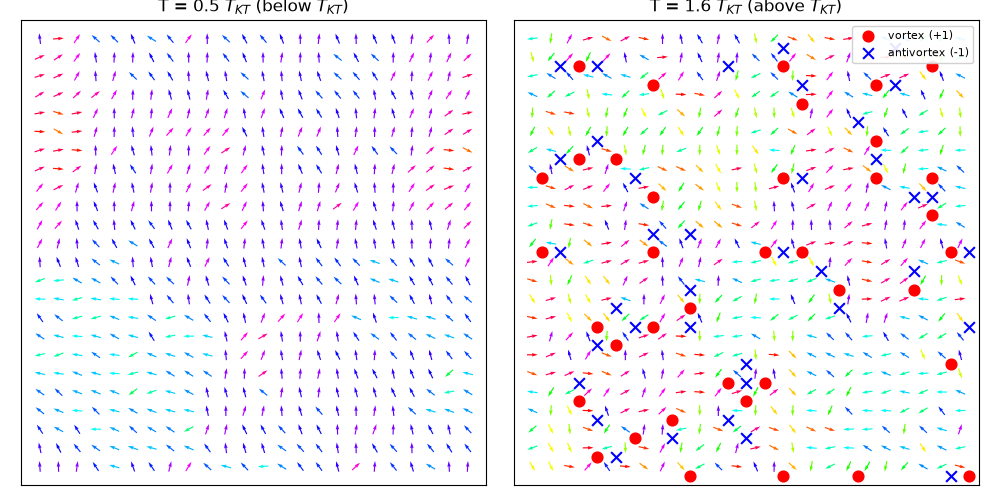
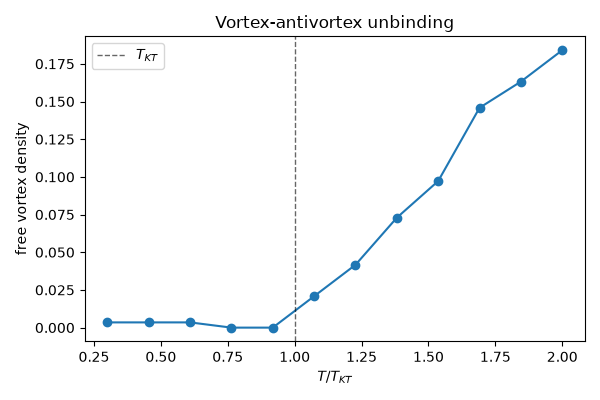
Because the spins live on a continuous circle rather than taking discrete values, the Mermin-Wagner theorem forbids spontaneous breaking of this continuous symmetry in two dimensions – the model cannot order in the conventional sense. Yet Kosterlitz and Thouless (1973 Nobel Prize, 2016) showed it still has a genuine phase transition, driven by topology rather than symmetry breaking: below \(T_{\text{KT}} \approx 0.893\, J/k_B\), vortices and antivortices are bound into tight pairs of zero net charge; above it, thermal fluctuations rip these pairs apart into a free “vortex plasma.” This example visualizes the spin texture and vortex cores below and above \(T_{\text{KT}}\), and tracks the free vortex density across the transition.
import matplotlib.pyplot as plt
import numpy as np

from physicskit.statphys.chapters.ising_lattice import XYModel2D
from physicskit.statphys.visualizers.vortex_render import plot_vortices
Spin textures below and above \(T_{KT}\)#
fig, axes = plt.subplots(1, 2, figsize=(10, 5))
for ax, T_ratio, label in zip(axes, [0.5, 1.6], ["below $T_{KT}$", "above $T_{KT}$"]):
    model = XYModel2D(L=24, J=1.0, kB=1.0, seed=0)
    T = T_ratio * model.T_KT
    model.sweep(beta=1.0 / T, n_sweeps=400)
    plot_vortices(model.theta, ax=ax, step=1)
    ax.set_title(f"T = {T_ratio:.1f} $T_{{KT}}$ ({label})")
plt.tight_layout()
Free vortex density across the transition#
model = XYModel2D(L=24, J=1.0, kB=1.0, seed=1)
T_ratios = np.linspace(0.3, 2.0, 12)
densities = []
for T_ratio in T_ratios:
    T = T_ratio * model.T_KT
    model.sweep(beta=1.0 / T, n_sweeps=300)
    n_v, n_av = model.vortex_count()
    densities.append((n_v + n_av) / model.n_sites)

plt.figure(figsize=(6, 4))
plt.plot(T_ratios, densities, marker="o")
plt.axvline(1.0, color="k", linestyle="--", linewidth=1, alpha=0.6, label="$T_{KT}$")
plt.xlabel("$T / T_{KT}$")
plt.ylabel("free vortex density")
plt.title("Vortex-antivortex unbinding")
plt.legend()
plt.tight_layout()
A snapshot grid across the transition#
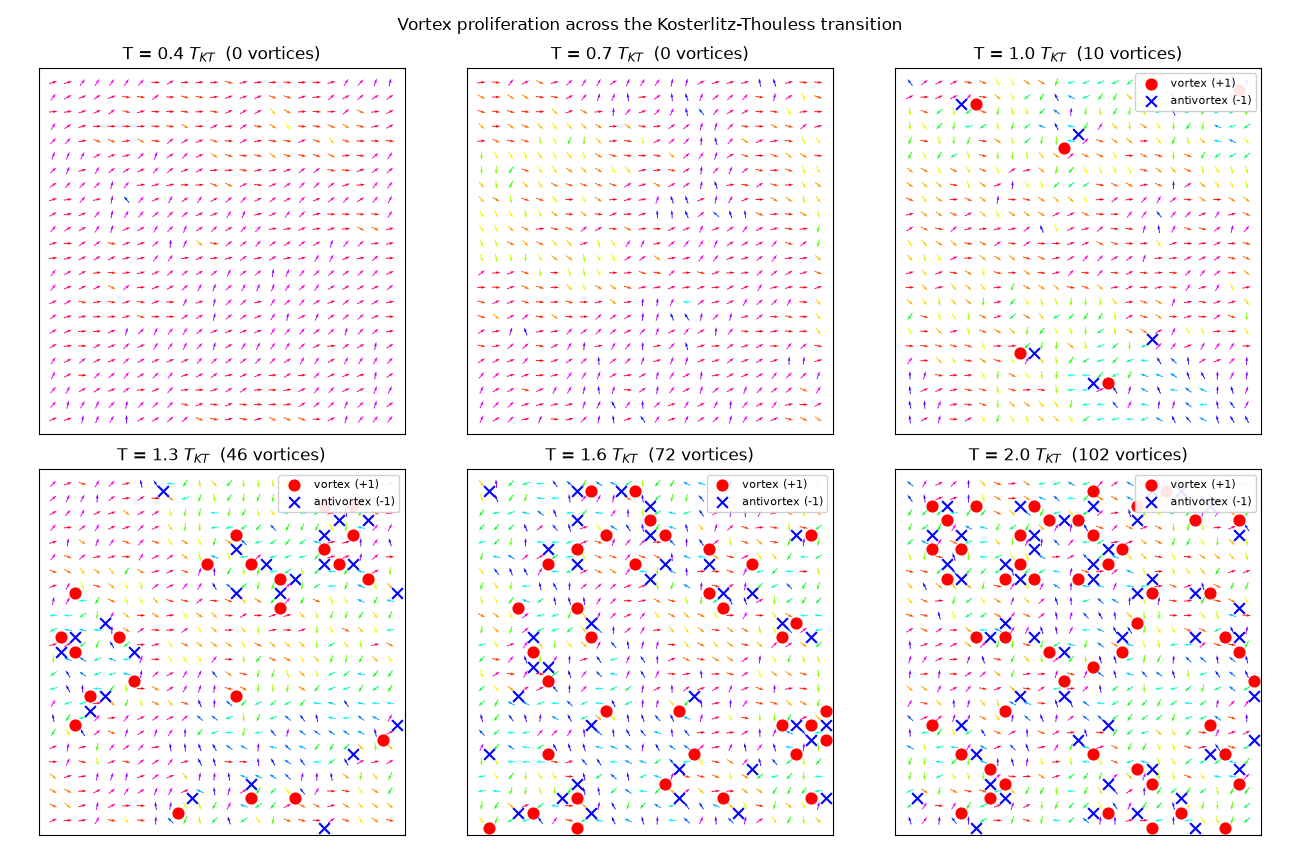
Rather than the two endpoints above, a finer temperature sweep of vortex snapshots shows the unbinding happening progressively: isolated, tightly bound vortex-antivortex pairs at low T gradually proliferate into a dense, unbound “vortex plasma” as T crosses T_KT.
T_ratios_grid = [0.4, 0.7, 1.0, 1.3, 1.6, 2.0]
fig, axes = plt.subplots(2, 3, figsize=(13, 8.5))
for ax, T_ratio in zip(axes.ravel(), T_ratios_grid):
    grid_model = XYModel2D(L=24, J=1.0, kB=1.0, seed=2)
    T = T_ratio * grid_model.T_KT
    grid_model.sweep(beta=1.0 / T, n_sweeps=400)
    plot_vortices(grid_model.theta, ax=ax, step=1)
    n_v, n_av = grid_model.vortex_count()
    ax.set_title(f"T = {T_ratio:.1f} $T_{{KT}}$  ({n_v + n_av} vortices)")
plt.suptitle("Vortex proliferation across the Kosterlitz-Thouless transition")
plt.tight_layout()
plt.show()
Check#
Vortices are rare below T_KT and proliferate above it.
Total running time of the script: (0 minutes 0.450 seconds)