
Note
Go to the end to download the full example code.
Flory’s mean-field exponent vs. the renormalization-group value#
good_solvent()
uses Flory’s original 1953 mean-field good-solvent exponent
(\(\nu=3/5\));
good_solvent_renormalization_group()
uses de Gennes’ 1979 renormalization-group-refined value
(\(\nu\approx0.588\)). The two exponents differ by only about 2%,
but because \(R\sim bn^\nu\) is a power law, that small an exponent
difference compounds with chain length: the two chain-size curves are
nearly indistinguishable on a log-log plot for short chains, yet the
relative difference between the predicted R values grows steadily as
n increases – exactly why precise critical exponents matter most for
long-chain, asymptotic behavior.
import matplotlib.pyplot as plt
import numpy as np

from chemistrykit.polymer.systems.chain_statistics import RealChain
from chemistrykit.polymer.visualizers.polymer_plots import plot_chain_scaling

b = 0.5  # segment length
n_values = np.logspace(1, 5, 30)

flory = RealChain.good_solvent()
de_gennes = RealChain.good_solvent_renormalization_group()

fig, axes = plt.subplots(1, 2, figsize=(11, 4.5))

plot_chain_scaling(
    {"Flory mean-field (nu=3/5)": flory, "de Gennes RG (nu~=0.588)": de_gennes},
    n_values,
    b,
    ax=axes[0],
)

R_flory = flory.end_to_end_distance(n_values, b)
R_de_gennes = de_gennes.end_to_end_distance(n_values, b)
percent_difference = 100.0 * (R_de_gennes - R_flory) / R_flory

axes[1].semilogx(n_values, percent_difference, color="steelblue")
axes[1].set_xlabel("n (segments)")
axes[1].set_ylabel("(R_de_gennes - R_flory) / R_flory  (%)")
axes[1].set_title("Relative difference vs. chain length")
fig.tight_layout()

plt.show()
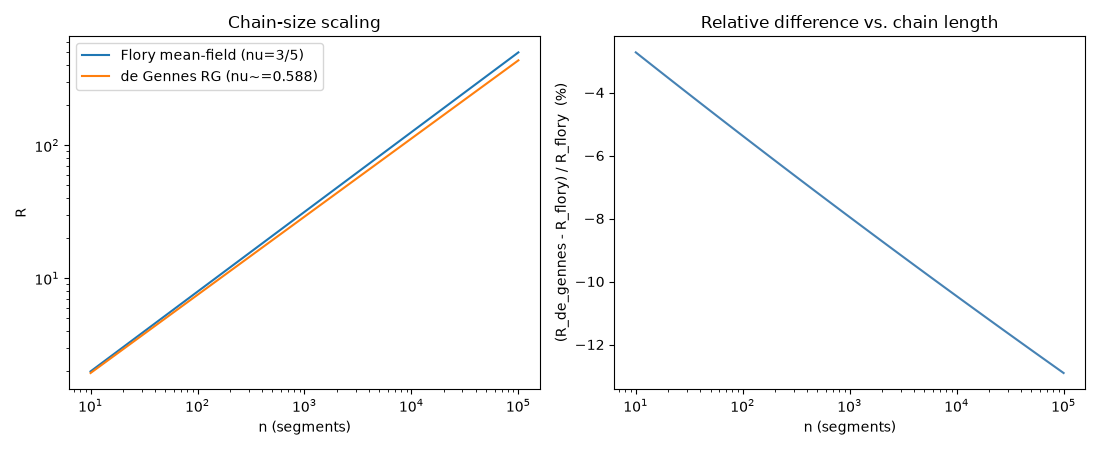
Flory’s simple mean-field exponent is within about 2% of the exact renormalization-group value – remarkably accurate for an estimate that predates the renormalization-group machinery used to check it by over two decades. But the right panel shows that 2% exponent gap is not the whole story: since chain size is a power of n, the two models’ predicted sizes diverge further apart the longer the chain, from a few percent at n~10 to well over 10% by n~10^4 – a small difference in a critical exponent has an outsized effect precisely in the long-chain limit where it is meant to apply.
Total running time of the script: (0 minutes 0.106 seconds)