
Note
Go to the end to download the full example code.
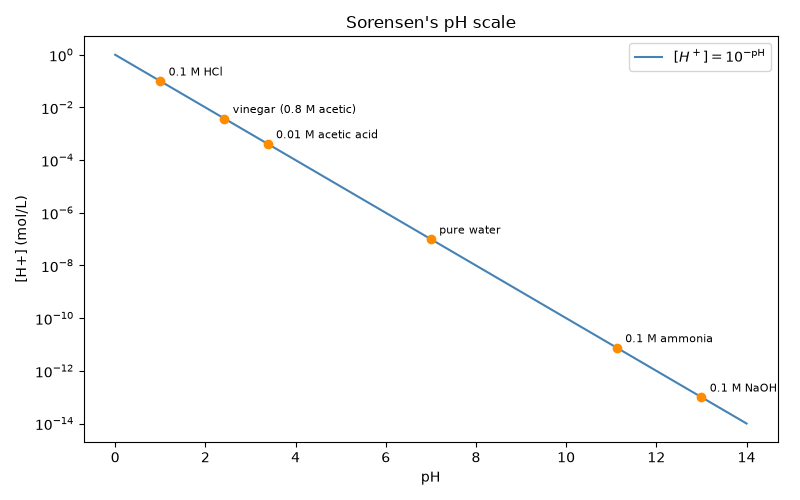
Sorensen’s pH scale: a logarithm for hydrogen-ion concentration#
Sorensen’s 1909 definition \(\mathrm{pH} = -\log_{10}[H^+]\)
(ph_from_h()) turns
hydrogen-ion concentrations spanning fourteen orders of magnitude into
numbers between 0 and 14. Below, the pH of several everyday solutions is
computed from their equilibrium \([H^+]\) and placed on the scale,
and the companion relation \(\mathrm{pH} + \mathrm{pOH} = pK_w = 14\)
is checked with poh_from_oh().
import matplotlib.pyplot as plt
import numpy as np

from chemistrykit.solutions.systems.acid_base import WeakAcid, WeakBase, h_from_ph, ph_from_h, poh_from_oh

Kw = 1.0e-14
samples = {
    "0.1 M HCl": 0.1,
    "vinegar (0.8 M acetic)": WeakAcid(Ca=0.8, Ka=1.8e-5).h_concentration(),
    "0.01 M acetic acid": WeakAcid(Ca=0.01, Ka=1.8e-5).h_concentration(),
    "pure water": np.sqrt(Kw),
    "0.1 M ammonia": Kw / WeakBase(Cb=0.1, Kb=1.8e-5).oh_concentration(),
    "0.1 M NaOH": Kw / 0.1,
}

pH_axis = np.linspace(0, 14, 200)
fig, ax = plt.subplots(figsize=(8, 5))
ax.semilogy(pH_axis, h_from_ph(pH_axis), color="steelblue", label=r"$[H^+] = 10^{-\mathrm{pH}}$")
for name, h in samples.items():
    pH = float(ph_from_h(h))
    ax.plot(pH, h, "o", color="darkorange")
    ax.annotate(name, (pH, h), textcoords="offset points", xytext=(6, 4), fontsize=8)
ax.set_xlabel("pH")
ax.set_ylabel("[H+] (mol/L)")
ax.set_title("Sorensen's pH scale")
ax.legend()
fig.tight_layout()
pH and pOH of each sample always sum to \(pK_w = 14\) at 25 degC:
0.1 M HCl               : [H+] = 1.00e-01 M, pH =  1.00, pOH = 13.00, sum = 14.00
vinegar (0.8 M acetic)  : [H+] = 3.79e-03 M, pH =  2.42, pOH = 11.58, sum = 14.00
0.01 M acetic acid      : [H+] = 4.15e-04 M, pH =  3.38, pOH = 10.62, sum = 14.00
pure water              : [H+] = 1.00e-07 M, pH =  7.00, pOH =  7.00, sum = 14.00
0.1 M ammonia           : [H+] = 7.50e-12 M, pH = 11.12, pOH =  2.88, sum = 14.00
0.1 M NaOH              : [H+] = 1.00e-13 M, pH = 13.00, pOH =  1.00, sum = 14.00
Total running time of the script: (0 minutes 0.059 seconds)