
Note
Go to the end to download the full example code.
Kirchhoff and Bunsen’s flame spectra: bright emission lines and matching dark absorption lines#
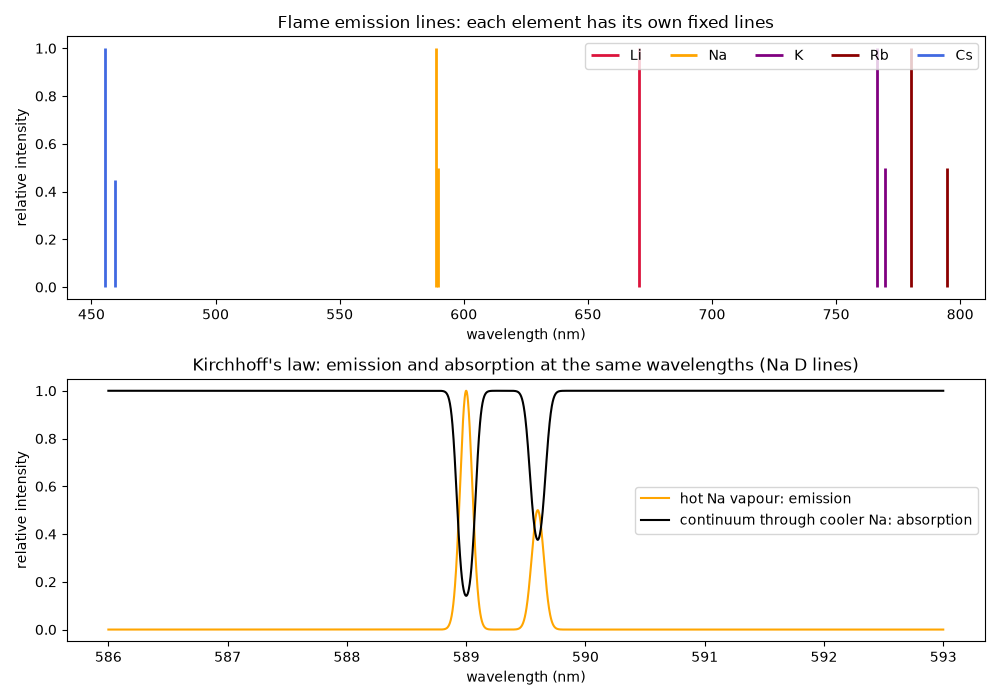
Bunsen and Kirchhoff (1859-1861) vaporized salts in a nearly colourless flame and found that each element gives bright lines at its own fixed wavelengths. The top panel shows the strongest visible and near-visible resonance lines of the alkali metals they studied, including caesium’s blue doublet and rubidium’s red and near-infrared lines, the lines that revealed those two new elements. The bottom panel illustrates Kirchhoff’s law: a cooler sodium vapour placed in front of a continuous source absorbs at exactly the wavelengths where hot sodium emits. This is what explains Fraunhofer’s D lines.
import matplotlib.pyplot as plt
import numpy as np

from chemistrykit.spectro.core.base_system import Spectrum

# Strongest resonance lines (air wavelengths, nm) with rough relative intensities.
elements = {
    "Li": Spectrum(positions=[670.8], intensities=[1.0]),
    "Na": Spectrum(positions=[589.0, 589.6], intensities=[1.0, 0.5]),
    "K": Spectrum(positions=[766.5, 769.9], intensities=[1.0, 0.5]),
    "Rb": Spectrum(positions=[780.0, 794.8], intensities=[1.0, 0.5]),
    "Cs": Spectrum(positions=[455.5, 459.3], intensities=[1.0, 0.45]),
}
colors = {"Li": "crimson", "Na": "orange", "K": "purple", "Rb": "darkred", "Cs": "royalblue"}

for name, spectrum in elements.items():
    print(f"{name:>2s} emission lines (nm): {spectrum.positions}")
Li emission lines (nm): [670.8]
Na emission lines (nm): [589.  589.6]
 K emission lines (nm): [766.5 769.9]
Rb emission lines (nm): [780.  794.8]
Cs emission lines (nm): [455.5 459.3]
Kirchhoff’s law of emission and absorption for sodium: hot sodium vapour gives bright lines, while cooler vapour in front of a continuous source removes light at the same two wavelengths.
wavelength = np.linspace(586.0, 593.0, 3000)
na = elements["Na"]
emission = na.broaden(wavelength, shape="gaussian", fwhm=0.12)
absorption_spectrum = np.ones_like(wavelength) * np.exp(-0.25 * na.broaden(wavelength, shape="gaussian", fwhm=0.12))

emission_peaks = [wavelength[np.argmax(np.where(np.abs(wavelength - p) < 0.2, emission, 0.0))] for p in na.positions]
absorption_dips = [wavelength[np.argmin(np.where(np.abs(wavelength - p) < 0.2, absorption_spectrum, 2.0))] for p in na.positions]
print(f"Na emission peaks at {np.round(emission_peaks, 2)} nm, absorption dips at {np.round(absorption_dips, 2)} nm")
Na emission peaks at [589. 589.6] nm, absorption dips at [589. 589.6] nm
fig, (ax1, ax2) = plt.subplots(2, 1, figsize=(10, 7))
for name, spectrum in elements.items():
    ax1.vlines(spectrum.positions, 0.0, spectrum.intensities, color=colors[name], lw=2, label=name)
ax1.set_xlim(440.0, 810.0)
ax1.set_xlabel("wavelength (nm)")
ax1.set_ylabel("relative intensity")
ax1.set_title("Flame emission lines: each element has its own fixed lines")
ax1.legend(ncol=5)

ax2.plot(wavelength, emission / emission.max(), color="orange", label="hot Na vapour: emission")
ax2.plot(wavelength, absorption_spectrum, color="black", label="continuum through cooler Na: absorption")
ax2.set_xlabel("wavelength (nm)")
ax2.set_ylabel("relative intensity")
ax2.set_title("Kirchhoff's law: emission and absorption at the same wavelengths (Na D lines)")
ax2.legend(loc="center right")
fig.tight_layout()
plt.show()
Total running time of the script: (0 minutes 0.086 seconds)