
Note
Go to the end to download the full example code.
Fourier-transform NMR: from a free-induction decay to a spectrum#
Ernst and Anderson (1966) replaced the slow frequency sweep of
continuous-wave NMR with a single short radio-frequency pulse. The pulse
excites all resonances at once. The resulting free-induction decay
(FID) is a sum of decaying oscillations, one per resonance, and its
Fourier transform gives the whole spectrum. Because each FID takes about
as long as a single scan and many can be averaged, the method is far
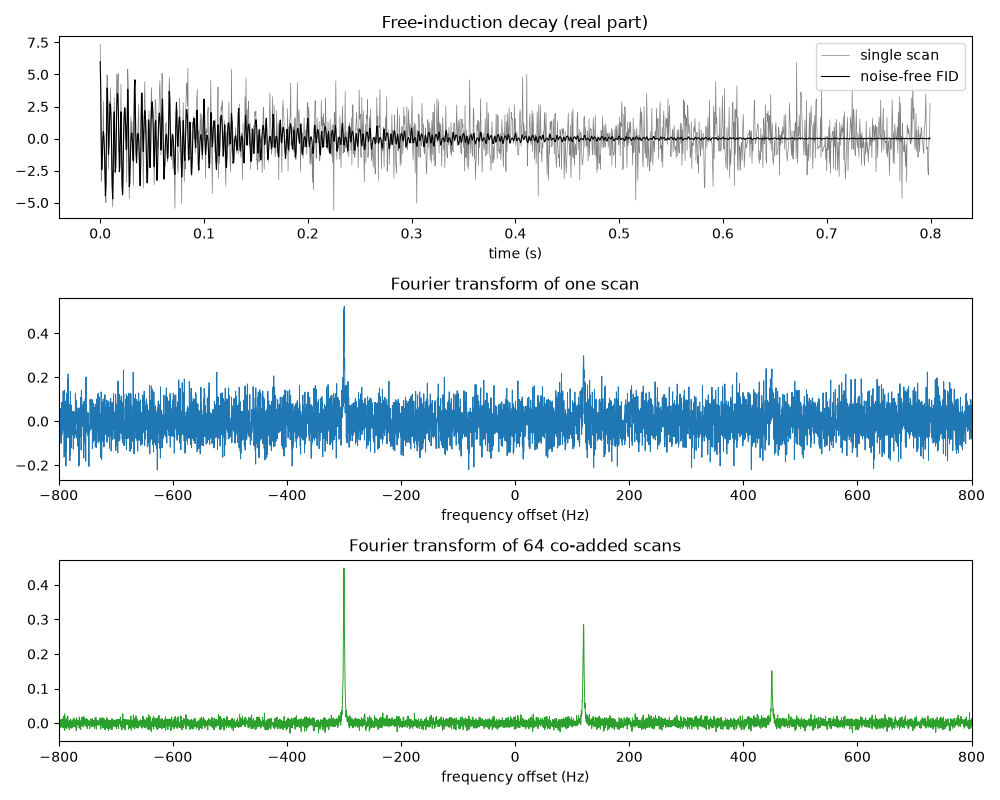
more sensitive. This example simulates a noisy FID for three
resonances with
free_induction_decay(),
transforms it with fid_to_spectrum(),
and shows signal averaging: signal-to-noise grows as
\(\sqrt{N}\) over N co-added scans.
import matplotlib.pyplot as plt
import numpy as np

from chemistrykit.spectro.systems.nmr import fid_to_spectrum, free_induction_decay

rng = np.random.default_rng(1966)
dwell, n_points, t2 = 5e-4, 8192, 0.15
t = np.arange(n_points) * dwell
offsets = np.array([-300.0, 120.0, 450.0])  # Hz from the carrier
amplitudes = np.array([3.0, 2.0, 1.0])
clean = free_induction_decay(t, offsets, amplitudes, t2)


def noisy_scan():
    """One acquisition: the ideal FID plus complex white noise."""
    return clean + 1.5 * (rng.standard_normal(n_points) + 1j * rng.standard_normal(n_points))


single = noisy_scan()
averaged = np.mean([noisy_scan() for _ in range(64)], axis=0)

freqs, spec_single = fid_to_spectrum(single, dwell)
_, spec_avg = fid_to_spectrum(averaged, dwell)

for offset in offsets:
    window = np.abs(freqs - offset) < 10.0
    print(f"line at {offset:+.0f} Hz recovered at {freqs[window][np.argmax(spec_avg[window])]:+.2f} Hz")
print(f"Lorentzian FWHM expected 1/(pi T2) = {1.0 / (np.pi * t2):.2f} Hz")
line at -300 Hz recovered at -300.05 Hz
line at +120 Hz recovered at +120.12 Hz
line at +450 Hz recovered at +449.95 Hz
Lorentzian FWHM expected 1/(pi T2) = 2.12 Hz
Signal-to-noise ratio: peak height over the standard deviation of a signal-free region. Averaging 64 scans should improve it by about 8.
quiet = np.abs(freqs) > 700.0


def snr(spec):
    return spec.max() / spec[quiet].std()


print(f"SNR single scan: {snr(spec_single):.1f}; 64 scans: {snr(spec_avg):.1f}; ratio {snr(spec_avg) / snr(spec_single):.1f} (sqrt(64) = 8)")
SNR single scan: 7.7; 64 scans: 54.5; ratio 7.1 (sqrt(64) = 8)
fig, axes = plt.subplots(3, 1, figsize=(10, 8))
axes[0].plot(t[:1600], single.real[:1600], color="0.5", lw=0.5, label="single scan")
axes[0].plot(t[:1600], clean.real[:1600], color="black", lw=0.8, label="noise-free FID")
axes[0].set_xlabel("time (s)")
axes[0].set_title("Free-induction decay (real part)")
axes[0].legend(loc="upper right")
axes[1].plot(freqs, spec_single, color="tab:blue", lw=0.7)
axes[1].set_title("Fourier transform of one scan")
axes[2].plot(freqs, spec_avg, color="tab:green", lw=0.7)
axes[2].set_title("Fourier transform of 64 co-added scans")
for ax in axes[1:]:
    ax.set_xlim(-800.0, 800.0)
    ax.set_xlabel("frequency offset (Hz)")
fig.tight_layout()
plt.show()
Total running time of the script: (0 minutes 0.109 seconds)