
Note
Go to the end to download the full example code.
Bethe’s pp-chain and CNO cycle: the energy source of stars#
Fifteen years after Eddington’s mass-luminosity relation described the consequences of a star’s energy output without explaining its source, Bethe (1939) worked out the two nuclear fusion chains that actually power it: the proton-proton (pp) chain, dominant in Sun-like stars, and the carbon-nitrogen-oxygen (CNO) cycle, dominant in hotter, more massive stars. Both fuse four hydrogen nuclei into one helium-4 nucleus,
releasing energy because helium-4 sits far higher on the nuclear
binding-energy-per-nucleon curve than hydrogen. This example computes
that net energy release with
physicskit.particle.nuclear.q_value(), and plots
binding_energy_per_nucleon() across
the periodic table to show exactly why the reaction is so exothermic –
and why the curve’s peak near iron marks the boundary between fusion and
fission as energy sources.
import matplotlib.pyplot as plt
import numpy as np

from physicskit.particle.nuclear import binding_energy_per_nucleon, q_value
The net energy release of hydrogen fusion#
Rest masses in MeV (CODATA/NIST values): the proton, the helium-4 nucleus (alpha particle), and the positron. Both the pp-chain and the CNO cycle (where carbon-12 acts only as a catalyst, regenerated at the end) have exactly the same net reactants and products, so the same Q-value applies to either route.
m_proton = 938.272
m_alpha = 3727.379
m_positron = 0.511

Q_nuclear = q_value([m_proton] * 4, [m_alpha, m_positron, m_positron])
print(f"nuclear Q-value, 4p -> He4 + 2e+ + 2nu:  {Q_nuclear:.3f} MeV")

# The two positrons each promptly annihilate with an ambient electron,
# releasing a further 2*m_e*c^2 per annihilation; adding that gives the
# textbook total energy release per cycle.
Q_total = Q_nuclear + 2 * (2 * m_positron)
print(f"+ subsequent annihilation of both positrons with ambient electrons: {2 * (2 * m_positron):.3f} MeV")
print(f"= total energy release per cycle: {Q_total:.3f} MeV  (the standard textbook value is ~26.7 MeV)")
print(f"as a fraction of the rest mass converted to energy: {Q_total / (4 * m_proton):.4%}")
nuclear Q-value, 4p -> He4 + 2e+ + 2nu:  24.687 MeV
+ subsequent annihilation of both positrons with ambient electrons: 2.044 MeV
= total energy release per cycle: 26.731 MeV  (the standard textbook value is ~26.7 MeV)
as a fraction of the rest mass converted to energy: 0.7122%
Why: helium-4 sits far higher on the binding-energy curve#
binding_energy_per_nucleon() evaluates the semi-empirical
(Weizsacker) mass formula’s \(B(Z,A)/A\). Along a simple
beta-stability approximation \(Z\approx A/(2+0.015A^{2/3})\), the
curve rises steeply from hydrogen, peaks near iron, and falls slowly
for heavier nuclei – explaining why fusing light nuclei (up to iron)
and fissioning heavy ones (down to iron) both release energy.
A_values = np.arange(4, 240)
Z_values = np.round(A_values / (2.0 + 0.015 * A_values ** (2.0 / 3.0))).astype(int)
bpn = np.array([binding_energy_per_nucleon(Z, A) for Z, A in zip(Z_values, A_values)])

bpn_he4 = binding_energy_per_nucleon(2, 4)
bpn_fe56 = binding_energy_per_nucleon(26, 56)
i_peak = np.argmax(bpn)
print(f"\nbinding energy/nucleon: hydrogen (A=1) = 0 MeV, helium-4 = {bpn_he4:.3f} MeV, iron-56 = {bpn_fe56:.3f} MeV")
print(f"curve peaks at A={A_values[i_peak]} with {bpn[i_peak]:.3f} MeV/nucleon")
print("(the semi-empirical formula is a bulk liquid-drop model with no shell corrections, so its light-nucleus")
print(" values -- helium-4 included -- are systematically less accurate than near the iron peak; the qualitative")
print(" shape driving fusion and fission alike is unaffected.)")

fig, ax = plt.subplots(figsize=(7, 4.8))
ax.plot(A_values, bpn, color="steelblue")
ax.scatter([4], [bpn_he4], color="orange", zorder=5, label=f"He-4: {bpn_he4:.2f} MeV")
ax.scatter([56], [bpn_fe56], color="firebrick", zorder=5, label=f"Fe-56 (near the peak): {bpn_fe56:.2f} MeV")
ax.axvspan(1, 56, alpha=0.08, color="orange", label="fusion releases energy")
ax.axvspan(56, 240, alpha=0.08, color="firebrick", label="fission releases energy")
ax.set_xlabel("mass number A")
ax.set_ylabel("binding energy per nucleon (MeV)")
ax.set_title("The binding-energy curve: why hydrogen fusion is exothermic")
ax.legend(fontsize=8, loc="lower right")
fig.tight_layout()

plt.show()
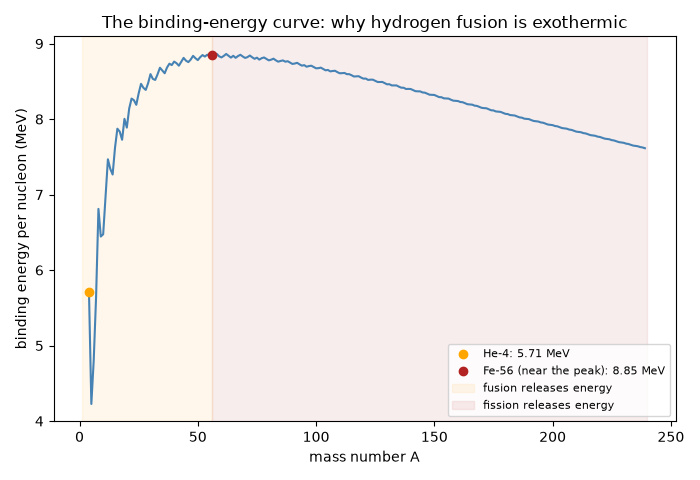
binding energy/nucleon: hydrogen (A=1) = 0 MeV, helium-4 = 5.710 MeV, iron-56 = 8.846 MeV
curve peaks at A=58 with 8.865 MeV/nucleon
(the semi-empirical formula is a bulk liquid-drop model with no shell corrections, so its light-nucleus
 values -- helium-4 included -- are systematically less accurate than near the iron peak; the qualitative
 shape driving fusion and fission alike is unaffected.)
Check#
4 p -> He4 releases 26.73 MeV (0.7% of the rest mass); binding per nucleon peaks near iron.
Total running time of the script: (0 minutes 0.043 seconds)