
Note
Go to the end to download the full example code.
Magnetic Pendulum: Fractal Basins of Attraction#
The magnetic pendulum is a damped bob, modeled in the small-swing (flat, 2D) limit at position \((x, y)\), pulled toward the origin by a linear restoring force and toward each of \(N\) fixed magnets at \((m_{x,k}, m_{y,k})\) by a softened inverse-square force:
where \(\gamma\) is friction, \(\kappa\) the restoring-force (“spring”) coefficient, \(S\) the magnet strength, and \(h\) the bob’s height above the magnet plane (which softens the pull so it never truly diverges directly above a magnet). This is the classic system for visualizing fractal basin boundaries: which magnet the bob eventually settles near depends on its starting position with famously fractal sensitivity. A tiny nudge in initial position can flip the outcome entirely, even though the bob’s long-term motion is not chaotic itself (it always settles down) – the sensitivity to initial conditions lives entirely in the geometry of the basin boundaries.
import matplotlib.pyplot as plt
import numpy as np

from physicskit.chaos.systems.continuous import MagneticPendulum, magnetic_pendulum_rhs
from physicskit.chaos.visualizers.basins import plot_basin_of_attraction

system = MagneticPendulum()
state0 = np.array([0.5, 0.5, 0.0, 0.0])
A single trajectory#
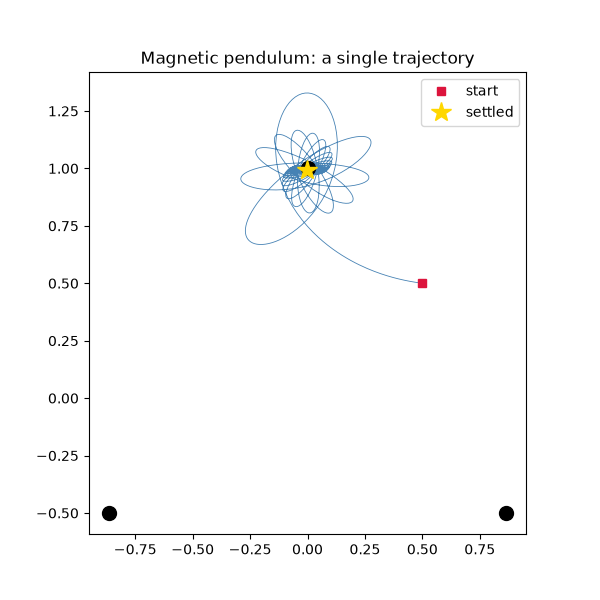
Released off-center, the bob spirals in and settles near one magnet.
t, states = system.trajectory(state0=state0, n_steps=5000, dt=0.02)

fig, ax = plt.subplots(figsize=(6, 6))
ax.plot(states[:, 0], states[:, 1], lw=0.6, color="steelblue")
ax.plot(*system.magnet_positions.T, "o", color="black", markersize=10)
ax.plot(states[0, 0], states[0, 1], "s", color="crimson", label="start")
ax.plot(states[-1, 0], states[-1, 1], "*", color="gold", markersize=15, label="settled")
ax.set_aspect("equal")
ax.legend()
ax.set_title("Magnetic pendulum: a single trajectory")
Text(0.5, 1.0, 'Magnetic pendulum: a single trajectory')
The basin of attraction map#
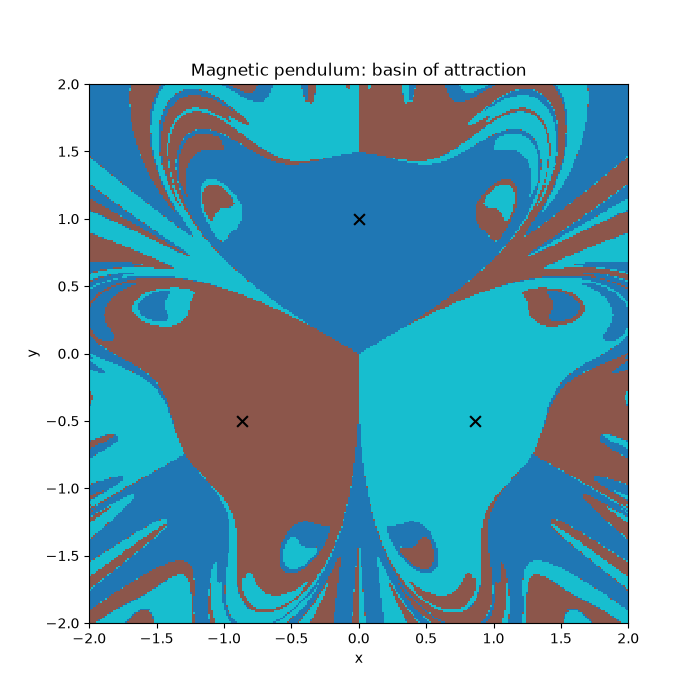
For every point on a grid of starting positions, integrate to find out which magnet the bob settles near, and color each pixel accordingly. The resulting boundary between colors is a fractal – zooming into any edge reveals more fine structure, forever.
fig2, ax2 = plot_basin_of_attraction(
    magnetic_pendulum_rhs,
    system.params,
    x_range=(-2.0, 2.0),
    y_range=(-2.0, 2.0),
    attractors=system.magnet_positions,
    resolution=300,
)
ax2.set_title("Magnetic pendulum: basin of attraction")

plt.show()
Check#
With friction the bob comes to rest above one of the three magnets.
distance = np.min(np.linalg.norm(system.magnet_positions - states[-1, :2], axis=1))
assert distance < 0.05 and np.hypot(*states[-1, 2:]) < 1e-3
Total running time of the script: (0 minutes 8.797 seconds)