
Note
Go to the end to download the full example code.
The Henon-Heiles system: Poincare sections and KAM torus breakdown#
HenonHeilesSystem
is the classic non-integrable 2-DOF Hamiltonian (originally a model of
stellar orbits in an axisymmetric galactic potential),
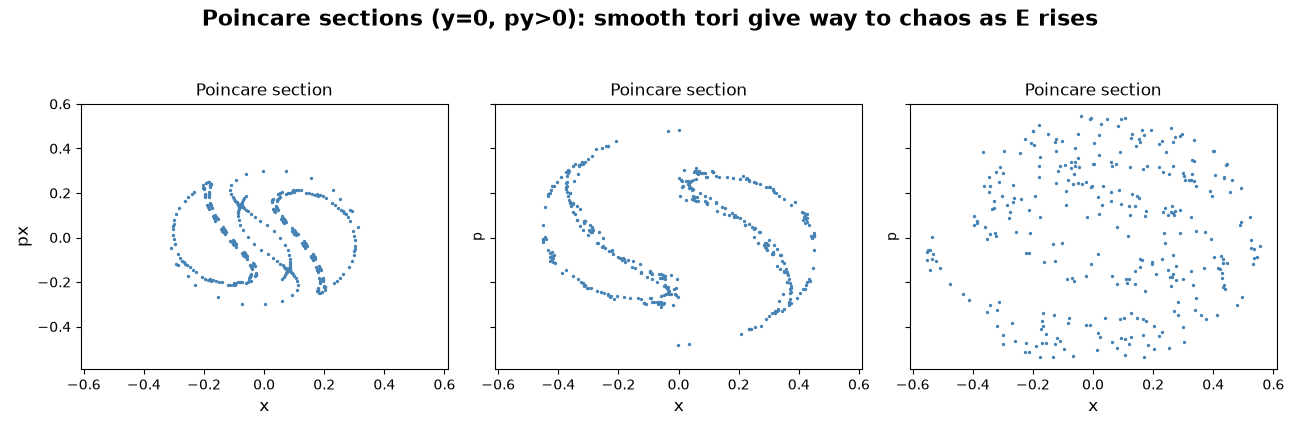
evolved here at three fixed energies \(E = H\), each with several trajectories launched from different starting angles on the \(y = 0\) line. Below \(E \approx 1/6\) the \((x, p_x)\) Poincare section at \(y = 0,\ p_y > 0\) is dominated by smooth invariant curves (KAM tori: nearly every trajectory is quasi-periodic). As \(E\) approaches and exceeds \(1/6\), more and more of those tori break up into a chaotic sea – one of the classic numerical demonstrations of the KAM theorem’s limits.
import matplotlib.pyplot as plt
import numpy as np

from physicskit.classical.systems.hamiltonian import HenonHeilesSystem
from physicskit.classical.visualizers.phase_space import plot_poincare_section

energies = [0.05, 0.1167, 0.16]
fig, axes = plt.subplots(1, 3, figsize=(13, 4.3), sharex=True, sharey=True)

rng = np.random.default_rng(0)
for ax, E in zip(axes, energies):
    ax.set_title(f"E = {E:.4f}", fontsize=14)
    # several trajectories per energy, different starting angles on the y=0 line
    for x0 in np.linspace(-0.3, 0.3, 6):
        v2 = 2 * E - x0**2  # from H = 0.5*(px^2+py^2) + 0.5*x^2 at y=0
        if v2 <= 0:
            continue
        px0 = np.sqrt(v2) * rng.choice([-1, 1]) * 0.6
        py0 = np.sqrt(max(v2 - px0**2, 1e-6))
        system = HenonHeilesSystem(np.array([x0, 0.0]), np.array([px0, py0]))
        result = system.integrate((0, 400), dt=0.01, method="yoshida4")
        plot_poincare_section(result.q[:, 0], result.p[:, 0], result.q[:, 1], result.p[:, 1], value=0.0, direction=1, ax=ax, color="steelblue")
    ax.set_xlabel("x", fontsize=12)
axes[0].set_ylabel("px", fontsize=12)
fig.suptitle("Poincare sections (y=0, py>0): smooth tori give way to chaos as E rises", fontsize=16, fontweight="bold")
fig.tight_layout(rect=[0, 0, 1, 0.93])

plt.show()
Check#
Energy is conserved along each orbit; below E = 1/12 nearby orbits stay together (tori), near E = 1/6 they separate exponentially (chaos).
assert np.ptp(result.energy) < 1e-6 * abs(result.energy[0])


def separation(E_val, t_end=200):
    x0, px0 = 0.0, 0.1
    py0 = np.sqrt(2 * E_val - px0**2)
    a = HenonHeilesSystem(np.array([x0, 0.0]), np.array([px0, py0])).integrate((0, t_end), dt=0.01, method="yoshida4")
    b = HenonHeilesSystem(np.array([x0 + 1e-8, 0.0]), np.array([px0, py0])).integrate((0, t_end), dt=0.01, method="yoshida4")
    return np.max(np.abs(a.q[-100:] - b.q[-100:]))


assert separation(0.05) < 1e-5 and separation(0.16) > 1e-3
Total running time of the script: (0 minutes 1.520 seconds)