
Note
Go to the end to download the full example code.
Wigner’s Semicircle Law#
GOE (\(\beta=1\)), GUE (\(\beta=2\)), and GSE (\(\beta=4\)) are the Gaussian random matrix ensembles built from real symmetric, complex Hermitian, and quaternionic self-dual Hermitian matrices respectively, with independent Gaussian entries. After rescaling eigenvalues by \(\sqrt{n\beta}\) (\(n\) the matrix size), the empirical spectral density of all three ensembles converges, as \(n \to \infty\), to Wigner’s semicircle law on \([-R, R]\) (\(R=2\) here):
This example reproduces that law – the same limiting curve for all three values of \(\beta\) – by histogramming Monte Carlo GOE/GUE/GSE spectra and overlaying the theoretical semicircle.
Reference: E. Wigner, Ann. Math. 62 (1955) 548; Ann. Math. 67 (1958) 325.
- Run:
python examples/paper_replications/wigner_semicircle_demo.py
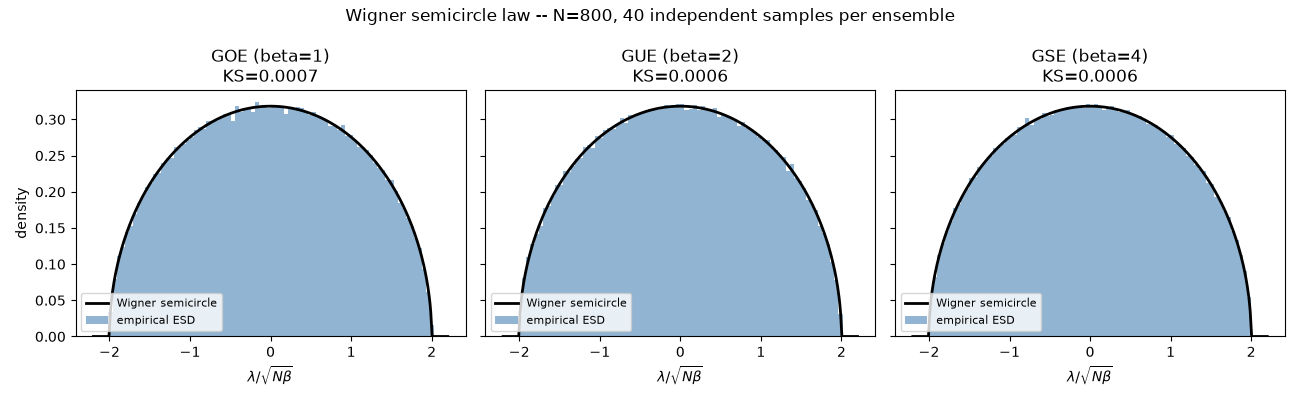
Saved wigner_semicircle_replication.png
import matplotlib.pyplot as plt
import numpy as np

import physicskit.rmt as rmt

ENSEMBLES = [
    ("GOE (beta=1)", rmt.ensembles.GOE),
    ("GUE (beta=2)", rmt.ensembles.GUE),
    ("GSE (beta=4)", rmt.ensembles.GSE),
]

N = 800
N_SAMPLES = 40
SEED = 2026

fig, axes = plt.subplots(1, 3, figsize=(13, 4), sharey=True)
x = np.linspace(-2.2, 2.2, 500)
benchmark = rmt.validation.WignerSemicircle()

for ax, (label, cls) in zip(axes, ENSEMBLES, strict=True):
    ensemble = cls(n=N, seed=SEED)
    spectrum = ensemble.sample(n_samples=N_SAMPLES)
    result = benchmark.validate(spectrum, seed=SEED)

    centers, counts = rmt.stats.empirical_density(spectrum, bins=80)
    ax.bar(centers, counts, width=centers[1] - centers[0], alpha=0.6, label="empirical ESD", color="steelblue")
    ax.plot(x, benchmark.theoretical_pdf(x), "k-", lw=2, label="Wigner semicircle")
    ax.set_title(f"{label}\nKS={result.ks_statistic:.4f}")
    ax.set_xlabel(r"$\lambda / \sqrt{N\beta}$")
    ax.legend(fontsize=8)

axes[0].set_ylabel("density")
fig.suptitle(
    f"Wigner semicircle law -- N={N}, {N_SAMPLES} independent samples per ensemble",
)
fig.tight_layout()
out_path = "wigner_semicircle_replication.png"
fig.savefig(out_path, dpi=150)
print(f"Saved {out_path}")
Total running time of the script: (0 minutes 1.073 seconds)