
Note
Go to the end to download the full example code.
The Wigner Surmise#
For the Gaussian ensembles GOE (\(\beta=1\)), GUE (\(\beta=2\)), GSE (\(\beta=4\)), neighboring eigenvalues repel: small spacings are suppressed relative to a Poisson process. The (generalized) Wigner surmise, derived exactly from the eigenvalue spacing of a 2x2 beta-ensemble and normalized to unit mean spacing, models the nearest-neighbor spacing density (after unfolding to unit mean level density) as
with \(a, b\) fixed by \(\int_0^\infty P_\beta\,ds = 1\) and \(\int_0^\infty s P_\beta\,ds = 1\); this reduces to the classical GOE/GUE/GSE surmises at \(\beta = 1, 2, 4\).
Because unfolding (rescaling eigenvalues to unit mean density) can itself introduce bias, this example cross-checks the spacing surmise against an independent, unfolding-free statistic: the ratio of consecutive spacings \(r_n = \min(s_n, s_{n-1})/\max(s_n, s_{n-1}) \in [0, 1]\). Its surmise (Atas et al. 2013), exact for a reduced 3-level model, has density
normalized numerically since the normalizing constant has no simple closed form. Agreement of both statistics with their respective surmises for GOE, GUE, and GSE rules out unfolding artifacts as an explanation for either.
References: E. Wigner – the original spacing surmise (beta=1). M. L. Mehta, Random Matrices (3rd ed.), Academic Press, 2004. Y. Y. Atas, E. Bogomolny, O. Giraud, G. Roux, Phys. Rev. Lett. 110, 084101 (2013) – the ratio-statistic surmise.
- Run:
python examples/paper_replications/wigner_surmise_demo.py
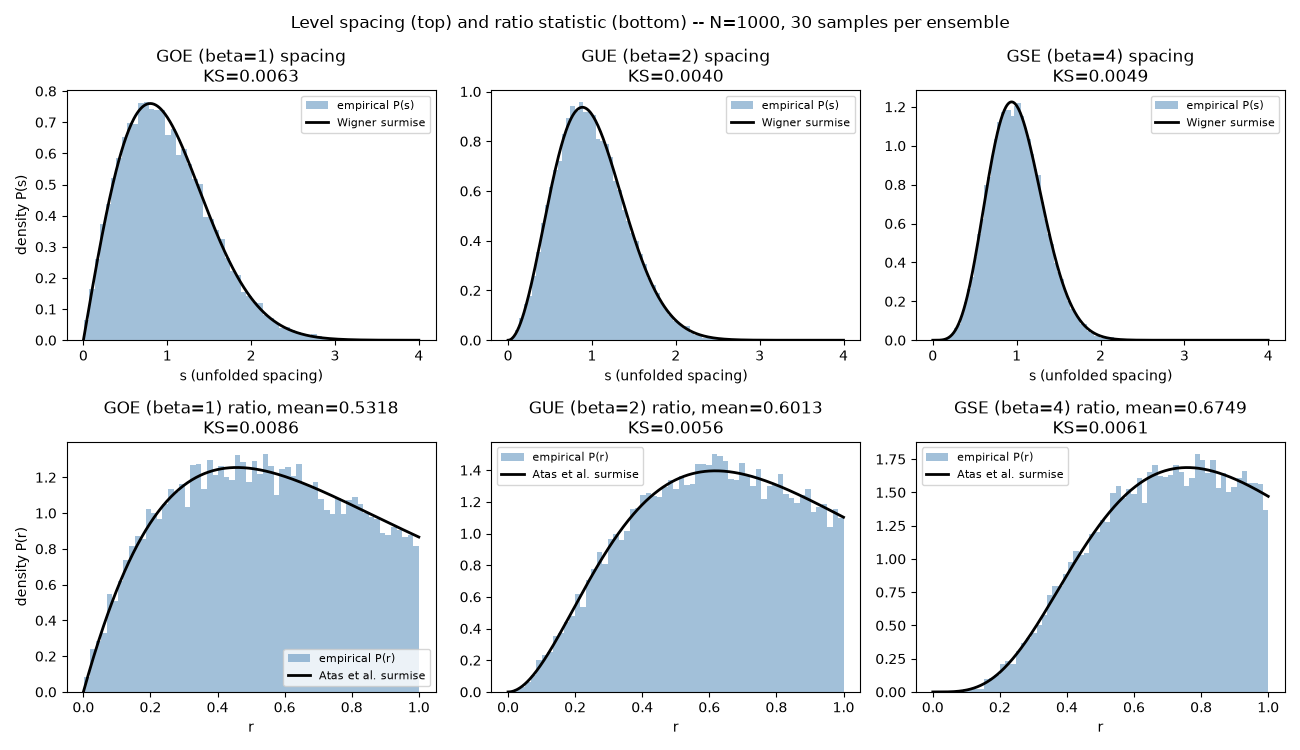
Saved wigner_surmise_replication.png
import matplotlib.pyplot as plt
import numpy as np

import physicskit.rmt as rmt

ENSEMBLES = [
    ("GOE (beta=1)", rmt.ensembles.GOE, 1),
    ("GUE (beta=2)", rmt.ensembles.GUE, 2),
    ("GSE (beta=4)", rmt.ensembles.GSE, 4),
]

N = 1000
N_SAMPLES = 30
SEED = 2026

fig, axes = plt.subplots(2, 3, figsize=(13, 7.5))
s_grid = np.linspace(0, 4, 400)
r_grid = np.linspace(0, 1, 400)

for col, (label, cls, beta) in enumerate(ENSEMBLES):
    ensemble = cls(n=N, seed=SEED)
    spectrum = ensemble.sample(n_samples=N_SAMPLES)

    # -- spacing distribution --
    spacings = rmt.stats.nearest_neighbor_spacings(spectrum, rmt.stats.semicircle_cdf)
    sp_bench = rmt.validation.WignerSurmise(beta=beta)
    sp_result = sp_bench.validate(spacings, seed=SEED)

    ax = axes[0, col]
    ax.hist(spacings, bins=60, density=True, alpha=0.5, color="steelblue", label="empirical P(s)")
    ax.plot(s_grid, sp_bench.theoretical_pdf(s_grid), "k-", lw=2, label="Wigner surmise")
    ax.set_title(f"{label} spacing\nKS={sp_result.ks_statistic:.4f}")
    ax.set_xlabel("s (unfolded spacing)")
    ax.legend(fontsize=8)

    # -- ratio distribution --
    ratios = rmt.stats.ratio_statistics(spectrum)
    r_bench = rmt.validation.RatioDistribution(beta=beta)
    r_result = r_bench.validate(ratios, seed=SEED)

    ax = axes[1, col]
    ax.hist(ratios, bins=60, density=True, alpha=0.5, color="steelblue", label="empirical P(r)")
    ax.plot(r_grid, r_bench.theoretical_pdf(r_grid), "k-", lw=2, label="Atas et al. surmise")
    ax.set_title(f"{label} ratio, mean={ratios.mean():.4f}\nKS={r_result.ks_statistic:.4f}")
    ax.set_xlabel("r")
    ax.legend(fontsize=8)

axes[0, 0].set_ylabel("density P(s)")
axes[1, 0].set_ylabel("density P(r)")
fig.suptitle(
    f"Level spacing (top) and ratio statistic (bottom) -- N={N}, {N_SAMPLES} samples per ensemble",
)
fig.tight_layout()
out_path = "wigner_surmise_replication.png"
fig.savefig(out_path, dpi=150)
print(f"Saved {out_path}")
Total running time of the script: (0 minutes 1.644 seconds)