
Note
Go to the end to download the full example code.
Le Chatelier’s principle: equilibrium shifts that oppose a disturbance#
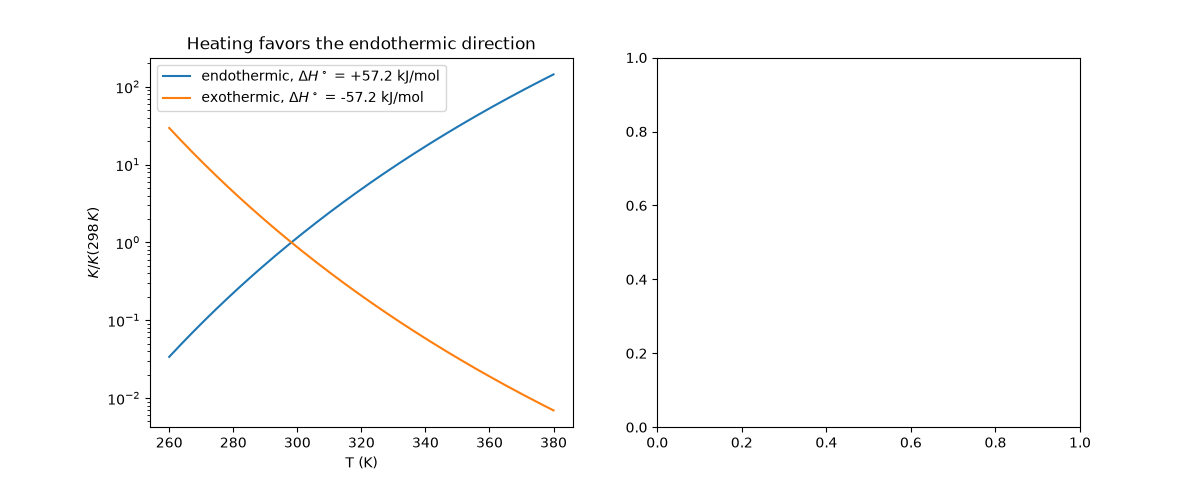
Two disturbances of \(N_2O_4 \rightleftharpoons 2NO_2\), an endothermic reaction that increases the number of gas molecules:
Heating raises \(K\) (
van_t_hoff_equilibrium_constant()), shifting toward \(NO_2\) to absorb the added heat; an exothermic reaction shifts the other way.Compressing leaves \(K\) unchanged but moves the equilibrium found by
solve_equilibrium_composition()toward \(N_2O_4\), the side with fewer molecules, partly relieving the pressure rise.
import matplotlib.pyplot as plt
import numpy as np

from chemistrykit.constants import R
from chemistrykit.thermo.systems.equilibrium import solve_equilibrium_composition, van_t_hoff_equilibrium_constant

T = np.linspace(260.0, 380.0, 200)
fig, axes = plt.subplots(1, 2, figsize=(12, 4.8))
axes[0].semilogy(T, van_t_hoff_equilibrium_constant(T, 298.15, 1.0, 57_200.0), label=r"endothermic, $\Delta H^\circ$ = +57.2 kJ/mol")
axes[0].semilogy(T, van_t_hoff_equilibrium_constant(T, 298.15, 1.0, -57_200.0), label=r"exothermic, $\Delta H^\circ$ = -57.2 kJ/mol")
axes[0].set_xlabel("T (K)")
axes[0].set_ylabel(r"$K / K(298\,K)$")
axes[0].set_title("Heating favors the endothermic direction")
axes[0].legend()
<matplotlib.legend.Legend object at 0x11aff27b0>
Fraction of N2O4 dissociated at 298.15 K as the total pressure rises.
T0 = 298.15
gf = [0.0, (57_200.0 - T0 * 175.8) / 2.0]
P_bar = np.logspace(-2, 2, 40)
alpha = []
for P in P_bar:
    res = solve_equilibrium_composition(("N2O4", "NO2"), [[-1.0], [2.0]], [1.0, 0.0], gf, T0, P=P * 1e5)
    alpha.append(res.extents[0])
K = np.exp(-(2 * gf[1]) / (R * T0))
axes[1].semilogx(P_bar, alpha, "o", label="Gibbs-minimization solver")
axes[1].semilogx(P_bar, np.sqrt(K / (K + 4 * P_bar)), color="crimson", label=r"closed form $\sqrt{K/(K+4P/P^\circ)}$")
axes[1].set_xlabel("total pressure (bar)")
axes[1].set_ylabel(r"fraction of $N_2O_4$ dissociated")
axes[1].set_title("Compression favors the side with fewer gas molecules")
axes[1].legend()
fig.tight_layout()

plt.show()
Total running time of the script: (0 minutes 0.129 seconds)