
Note
Go to the end to download the full example code.
Henon Map#
The Henon map is a simple 2D quadratic map,
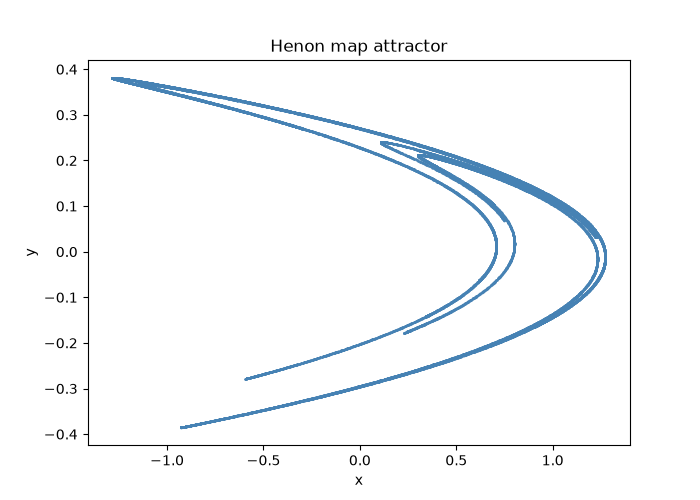
whose classic parameters (\(a=1.4\), \(b=0.3\)) produce a strange attractor with the map’s signature fractal, self-similar structure. Unlike the (area-preserving) standard and baker’s maps, the Henon map is dissipative – its Jacobian determinant is the constant \(-b\), with \(|b|<1\) – so nearby points contract in area on average even while they stretch apart along the attractor’s unstable direction. This example iterates a single long trajectory and scatter-plots it.
The finished attractor#
Discard a short initial transient so the plotted points already lie on the attractor, then plot the full, much longer orbit at once to reveal the map’s signature fractal, self-similar structure – especially visible when zooming into the folds.
The route there: a bifurcation diagram over a#
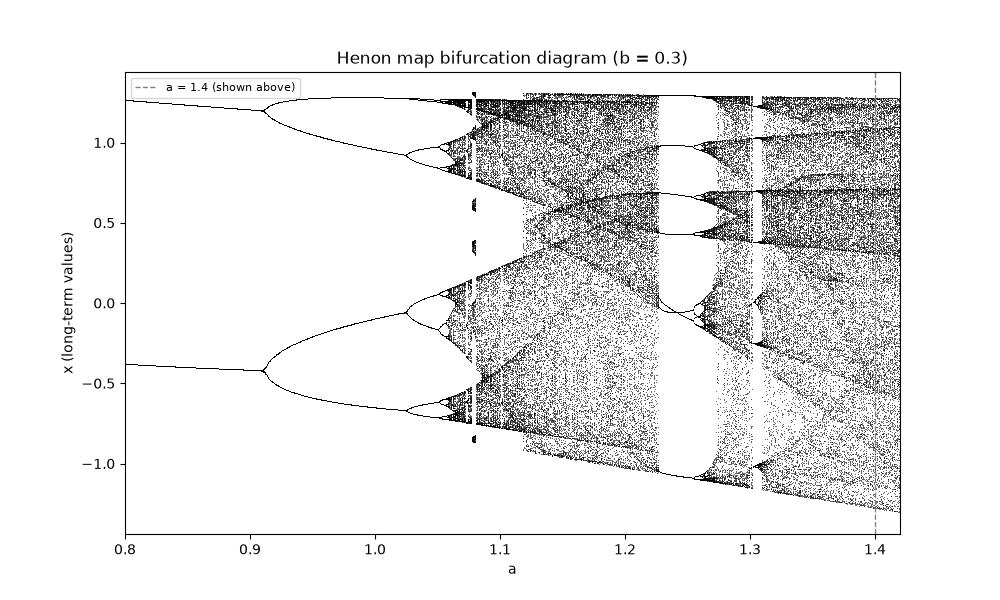
The single attractor above is only the end state at one fixed a
(b held at its classic 0.3). Sweeping a and, for each value,
plotting the surviving long-term x values – exactly the same
plot_bifurcation_diagram()
machinery used for the Logistic Map
– shows how that attractor is reached: a period-doubling cascade out of
simple fixed points and cycles, opening into the fractal chaotic band at
the classic a = 1.4 used above (dashed line), interrupted by visible
periodic windows.
a_values = np.linspace(0.8, 1.42, 1200)
sampler = map_bifurcation_sampler(lambda a: HenonMap(a=a, b=0.3), state0=np.array([0.0, 0.0]), n_transient=300, n_keep=150)

fig2, ax2 = plot_bifurcation_diagram(a_values, sampler)
ax2.axvline(1.4, color=theme.MUTED, ls="--", lw=1.0, label="a = 1.4 (shown above)")
ax2.set_xlabel("a")
ax2.set_ylabel("x (long-term values)")
ax2.set_title("Henon map bifurcation diagram (b = 0.3)")
ax2.legend(fontsize=8)

plt.show()
Check#
The Henon attractor fills |x| < 1.29, |y| < 0.39; below a = 0.9125 the map sits on a period-2 orbit (here a = 0.8: x = 1.2596, -0.3846).
Total running time of the script: (0 minutes 0.085 seconds)