
Note
Go to the end to download the full example code.
Detecting a single quantum of circulation#
Lars Onsager (1949) and, independently, Richard Feynman (1955) proposed that frictionless superfluid helium-4 can only rotate by threading itself with discrete vortex lines, each carrying exactly one quantum of circulation,
because the superfluid velocity \(\mathbf{v}=(\hbar/m)\nabla\theta\)
is the gradient of the condensate’s phase \(\theta\), and a
single-valued wavefunction only allows \(\theta\) to wind around a
core by an integer multiple of \(2\pi\).
gpe_imprint_vortex() builds
exactly this winding by multiplying the wavefunction by
\((x-x_0)+i(y-y_0)\), and
count_vortices() detects the
same quantization directly, as an exact integer phase winding summed
around each grid plaquette, imprinted here on a Gaussian condensate
exactly as Onsager and Feynman’s argument requires.
import matplotlib.pyplot as plt
import numpy as np

from physicskit.fields import count_vortices, gpe_imprint_vortex, harmonic_trap_grid, plot_bec_density, plot_bec_phase
A Gaussian condensate with a single vortex imprinted at the center#
Sum the phase winding around every plaquette of the grid#
Exactly one quantum of circulation, \(\oint\mathbf{v}\cdot d\boldsymbol{\ell} = h/m\), is detected – the discrete vortex line Onsager and Feynman predicted, decades before it was observed directly.
fig, ax = plot_bec_phase(X, Y, psi)
ax.set_title(f"total winding detected: {np.sum(np.abs(winding))}")
fig.tight_layout()

print(f"total quantized circulation detected: {np.sum(np.abs(winding))} (expected: 1)")
print(f"density at the vortex core: |psi(0,0)|^2 = {np.abs(psi[n // 2, n // 2]) ** 2:.2e} (expected: ~0)")
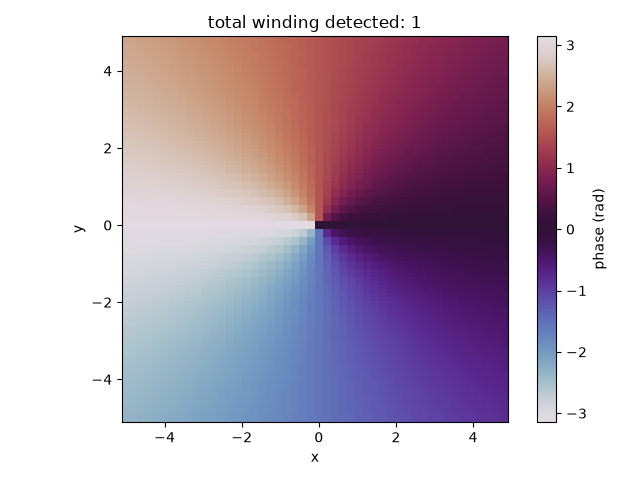
total quantized circulation detected: 1 (expected: 1)
density at the vortex core: |psi(0,0)|^2 = 0.00e+00 (expected: ~0)
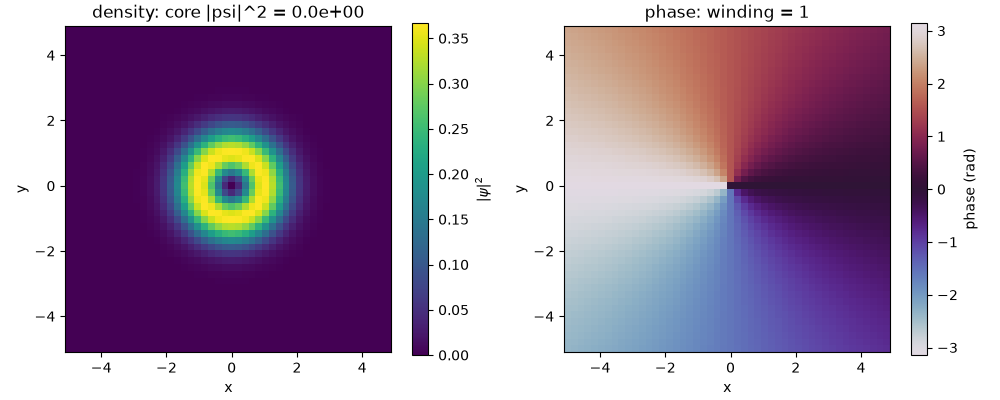
The two complementary views of the same vortex core#
The phase plot above shows the \(2\pi\) winding; the density,
plotted alongside it, shows the same vortex core the complementary way
– as the zero that a single-valued wavefunction’s phase singularity
necessarily forces the amplitude down to (see
plot_bec_density()).
fig2, (ax_density, ax_phase) = plt.subplots(1, 2, figsize=(10, 4))
plot_bec_density(X, Y, psi, ax=ax_density)
ax_density.set_title(f"density: core |psi|^2 = {np.abs(psi[n // 2, n // 2]) ** 2:.1e}")
plot_bec_phase(X, Y, psi, ax=ax_phase)
ax_phase.set_title(f"phase: winding = {np.sum(np.abs(winding))}")
fig2.tight_layout()
Check#
Circulation is quantized (winding 1) and the density vanishes at the core.
Total running time of the script: (0 minutes 0.104 seconds)