
Note
Go to the end to download the full example code.
The Hulse-Taylor binary pulsar: the first (indirect) evidence for gravitational waves#
Long before LIGO’s 2015 direct detection, Hulse and Taylor’s 1974 discovery of the binary pulsar PSR B1913+16 gave the first evidence that gravitational waves are real: the pair’s orbital period has been measured to shrink at almost exactly the rate General Relativity predicts for energy loss to gravitational radiation, accumulating to a spectacular match after decades of radio timing – work that earned the 1993 Nobel Prize in Physics. Peters (1964) showed that a binary of masses \(m_1, m_2\) and eccentricity \(e\) on a semi-major axis \(a\) shrinks at a rate
purely from the quadrupole gravitational radiation this orbital motion sources; the corresponding orbital-period decay rate \(dP/dt\) follows via Kepler’s third law (\(dP/da = 3\pi\sqrt{a/M}\)). This example reproduces that calculation using PSR B1913+16’s actual measured orbital parameters: two neutron stars of \(m_1 = 1.4398\,M_\odot\) and \(m_2 = 1.3886\,M_\odot\), an orbital period of 7.75 hours, and an eccentricity \(e = 0.6171\).
import matplotlib.pyplot as plt
import numpy as np

import physicskit.relativity.utils.constants as const
from physicskit.relativity.chapters.gw_merger import BinaryMerger
PSR B1913+16’s real parameters#
m1_solar, m2_solar = 1.4398, 1.3886
period_s = 27906.98  # 7.75 hours
eccentricity = 0.6171338
observed_dPdt = -2.4056e-12  # dimensionless (s/s), from decades of radio timing

m1 = const.solar_masses_to_geometrized(m1_solar)
m2 = const.solar_masses_to_geometrized(m2_solar)
pulsar = BinaryMerger(m1=m1, m2=m2, distance=1.0)

semi_major_axis = (pulsar.total_mass * (period_s * const.C_SI) ** 2 / (4.0 * np.pi**2)) ** (1.0 / 3.0)
predicted_dPdt = pulsar.period_decay_rate(semi_major_axis, eccentricity)

print(f"Component masses: {m1_solar} and {m2_solar} solar masses")
print(f"Orbital period: {period_s / 3600.0:.3f} hours, eccentricity: {eccentricity}")
print(f"Predicted dP/dt:  {predicted_dPdt:.4e}")
print(f"Observed dP/dt:   {observed_dPdt:.4e}")
print(f"Agreement: {100.0 * predicted_dPdt / observed_dPdt:.2f}%")
Component masses: 1.4398 and 1.3886 solar masses
Orbital period: 7.752 hours, eccentricity: 0.6171338
Predicted dP/dt:  -2.4027e-12
Observed dP/dt:   -2.4056e-12
Agreement: 99.88%
Project the accumulated orbital phase shift over the observation baseline#
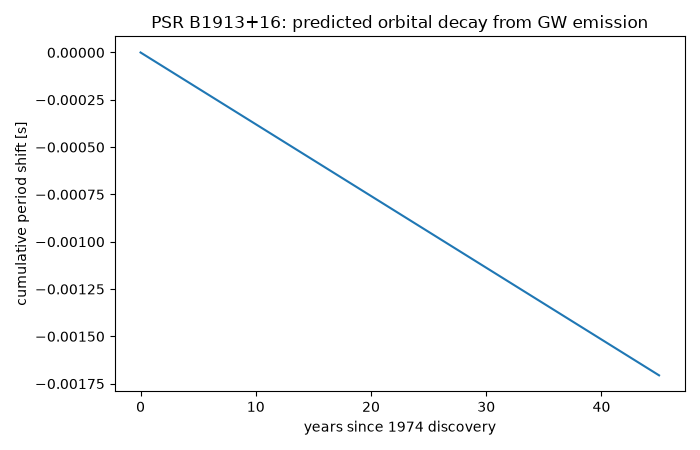
Integrating dP/dt over time predicts a slowly growing shift in the time of periastron passage relative to a non-decaying orbit – the signature that was actually tracked in the radio timing data.
years = np.linspace(0.0, 45.0, 200)
seconds = years * 365.25 * 24.0 * 3600.0
cumulative_period_shift = 0.5 * predicted_dPdt * seconds  # d(period)/dt is ~constant over this baseline

plt.figure(figsize=(7, 4.5))
plt.plot(years, cumulative_period_shift)
plt.xlabel("years since 1974 discovery")
plt.ylabel("cumulative period shift [s]")
plt.title("PSR B1913+16: predicted orbital decay from GW emission")
plt.tight_layout()
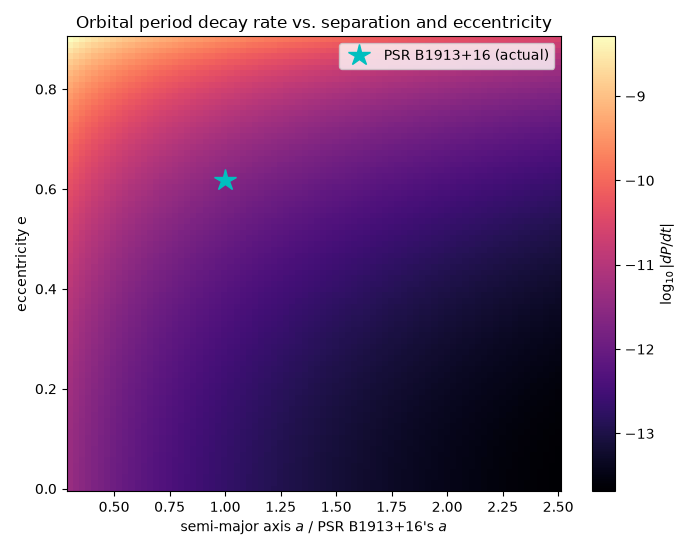
The period-decay rate across the full (semi-major axis, eccentricity) plane#
period_decay_rate()
depends steeply on both the orbital separation and the eccentricity (the
\((1-e^2)^{-7/2}\) enhancement factor), not just on PSR B1913+16’s
particular orbit. Mapping it out shows why eccentric, tight binaries are
such efficient gravitational-wave emitters: at fixed separation, spinning
up the eccentricity from 0 to PSR B1913+16’s measured \(e=0.62\)
already accelerates the decay by more than an order of magnitude.
a_grid = np.linspace(0.3 * semi_major_axis, 2.5 * semi_major_axis, 80)
e_grid = np.linspace(0.0, 0.9, 80)
A_grid, E_grid = np.meshgrid(a_grid, e_grid)
dPdt_map = pulsar.period_decay_rate(A_grid, E_grid)

fig, ax = plt.subplots(figsize=(7, 5.5))
im = ax.pcolormesh(
    a_grid / semi_major_axis,
    e_grid,
    np.log10(-dPdt_map),
    shading="auto",
    cmap="magma",
)
plt.colorbar(im, ax=ax, label=r"$\log_{10}|dP/dt|$")
ax.plot(1.0, eccentricity, "c*", ms=16, label="PSR B1913+16 (actual)")
ax.set_xlabel(r"semi-major axis $a$ / PSR B1913+16's $a$")
ax.set_ylabel("eccentricity e")
ax.set_title("Orbital period decay rate vs. separation and eccentricity")
ax.legend()
plt.tight_layout()
plt.show()
Check#
Peters-Mathews period decay for PSR B1913+16 within 0.5% of the timing data.
assert abs(predicted_dPdt / observed_dPdt - 1) < 0.005
Total running time of the script: (0 minutes 0.090 seconds)