
Note
Go to the end to download the full example code.
The Maslov index: caustics and Keller’s quantization condition#
The Van Vleck-Morette semiclassical propagator (The Van Vleck-Morette semiclassical propagator) needs a topological correction beyond its classical action and stability prefactor: every time a classical trajectory crosses a caustic (a focal point where \(\partial q_t/\partial p_0=0\)), the propagator picks up an extra phase of \(-\pi/2\). Joseph Keller’s corrected Bohr-Sommerfeld (EBK) quantization condition built exactly this caustic-counting correction into the old quantum theory, and Viktor Maslov later showed that the resulting phase count – the Maslov index \(\mu\) – is a topological invariant of the trajectory itself, rather than an artifact of the coordinates used to compute it.
For a unit-mass, unit-frequency harmonic oscillator,
\(V(q)=\tfrac12m\omega^2q^2\) with \(m=\omega=1\), a classical
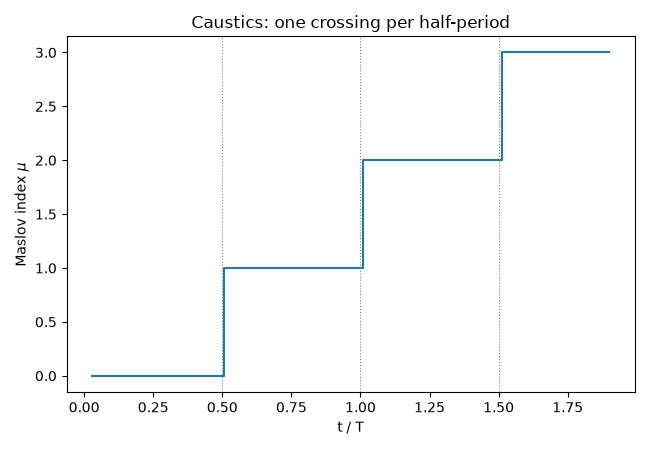
trajectory crosses exactly one focal point every half-period, so
\(\mu(t)\) should step upward by one at
\(t=T/2,\,T,\,3T/2,\dots\) and keep doing so however many periods it
is followed for –
count_caustics() counts
exactly these sign changes of \(\partial q_t/\partial p_0\) along the
trajectory
(propagate_trajectory_monodromy_action()).
import matplotlib.pyplot as plt
import numpy as np
from numba import njit

from physicskit.semiclassical.core.propagators import (
    count_caustics,
    propagate_trajectory_monodromy_action,
)

m, omega = 1.0, 1.0
params = np.array([m * omega**2])


@njit(cache=True)
def dVdx(q, params):
    return params[0] * q


@njit(cache=True)
def d2Vdx2(q, params):
    return params[0]


@njit(cache=True)
def V(q, params):
    return 0.5 * params[0] * q**2


q0, p0 = 1.0, 0.3
T_period = 2 * np.pi / omega


def maslov_index(t):
    steps = 4000
    dt = t / steps
    _, _, _, _, Mqp_hist = propagate_trajectory_monodromy_action(q0, p0, dVdx, d2Vdx2, V, m, dt, steps, params)
    return count_caustics(Mqp_hist)


# Over many periods, crossing several caustics: the Maslov index itself
# needs no branch-sensitive comparison to an exact quantum formula, just a
# count of sign changes.
times_full = np.linspace(0.03, 1.9, 150) * T_period
mu_history = np.array([maslov_index(t) for t in times_full])
The Maslov index counting caustic crossings once per half-period, over many periods ————————————————————————–
fig, ax = plt.subplots(figsize=(6.5, 4.5))
ax.plot(times_full / T_period, mu_history, drawstyle="steps-post")
for k in range(1, 4):
    ax.axvline(0.5 * k, color="gray", ls=":", lw=0.8)
ax.set_xlabel("t / T")
ax.set_ylabel(r"Maslov index $\mu$")
ax.set_title("Caustics: one crossing per half-period")
fig.tight_layout()
Check#
The harmonic oscillator focuses every half period: the Maslov index counts floor(2t / T) caustics (checked away from the focal times themselves).
expected = np.floor(times_full / (T_period / 2))
away = np.abs(times_full / (T_period / 2) - np.round(times_full / (T_period / 2))) > 0.02
assert np.all(mu_history[away] == expected[away])
Total running time of the script: (0 minutes 0.406 seconds)