
Note
Go to the end to download the full example code or to run this example in your browser via JupyterLite.
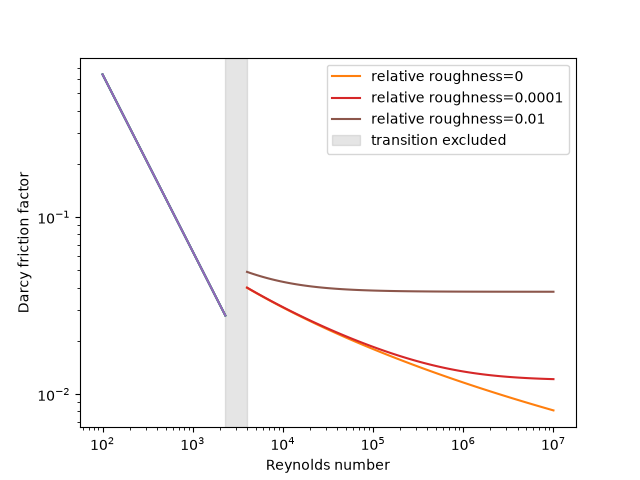
Darcy friction across two flow regimes#
Compute an inspectable engineering model using SI inputs. See the linked domain guide for assumptions and benchmark checks.
import matplotlib.pyplot as plt
import numpy as np

from engineeringkit.fluid_engineering import colebrook_friction_factor

fig, ax = plt.subplots()
for roughness in [0, 1e-4, 0.01]:
    for lower, upper in [(100, 2299), (4000, 1e7)]:
        re = np.logspace(np.log10(lower), np.log10(upper), 100)
        factors = [colebrook_friction_factor(value, roughness) for value in re]
        label = f"relative roughness={roughness}" if lower == 4000 else None
        ax.loglog(re, factors, label=label)
ax.axvspan(2300, 4000, color="gray", alpha=0.2, label="transition excluded")
ax.set(xlabel="Reynolds number", ylabel="Darcy friction factor")
ax.legend()

plt.show()
Total running time of the script: (0 minutes 0.267 seconds)
