
Note
Go to the end to download the full example code or to run this example in your browser via JupyterLite.
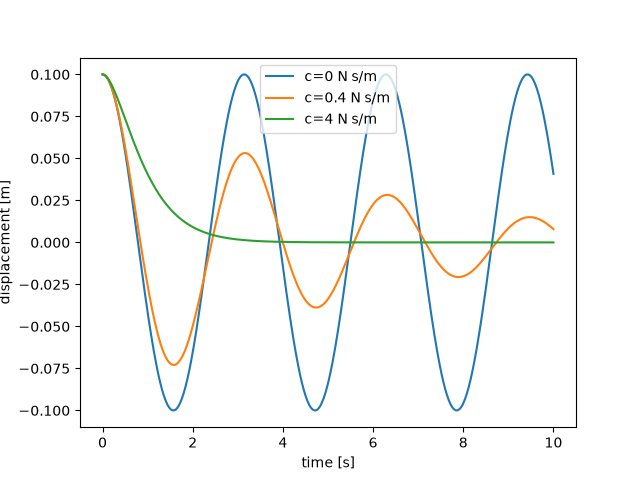
Damping and vibration histories#
Compute an inspectable engineering model using SI inputs. See the linked domain guide for assumptions and benchmark checks.
import matplotlib.pyplot as plt
import numpy as np

from engineeringkit.mechanical_engineering import simulate_sdof

t = np.linspace(0, 10, 501)
fig, ax = plt.subplots()
for damping in [0, 0.4, 4]:
    result = simulate_sdof(1, damping, 4, x0=0.1, t=t)
    ax.plot(result.t, result.displacement, label=f"c={damping} N s/m")
ax.set(xlabel="time [s]", ylabel="displacement [m]")
ax.legend()

plt.show()
Total running time of the script: (0 minutes 0.154 seconds)
