
Note
Go to the end to download the full example code or to run this example in your browser via JupyterLite.
Redundancy under independent failures#
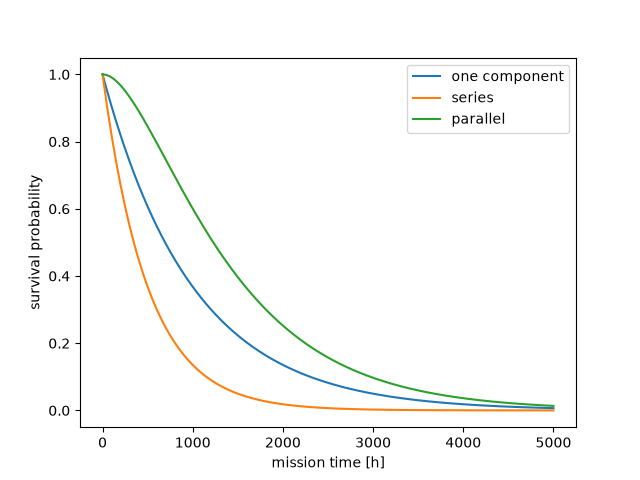
Two independent components provide a simple comparison of series and parallel architectures. At the component half-life, the series system survives with probability one quarter and the parallel system with probability three quarters.
import matplotlib.pyplot as plt
import numpy as np

from engineeringkit.reliability import exponential_reliability, parallel_reliability, series_reliability

lam = 0.001
t = np.linspace(0, 5000, 201)
r = exponential_reliability(t, lam)
series = np.array([series_reliability(ri, ri) for ri in r])
parallel = np.array([parallel_reliability(ri, ri) for ri in r])
assert np.isclose(series_reliability(0.5, 0.5), 0.25)
assert np.isclose(parallel_reliability(0.5, 0.5), 0.75)
assert np.all(series <= r) and np.all(r <= parallel)
fig, ax = plt.subplots()
for values, label in [(r, "one component"), (series, "series"), (parallel, "parallel")]:
    ax.plot(t, values, label=label)
ax.set(xlabel="mission time [h]", ylabel="survival probability")
ax.legend()

plt.show()
Total running time of the script: (0 minutes 0.079 seconds)
