
Note
Go to the end to download the full example code or to run this example in your browser via JupyterLite.
Sampling and a signal spectrum#
Compute an inspectable engineering model using SI inputs. See the linked domain guide for assumptions and benchmark checks.
import matplotlib.pyplot as plt
import numpy as np

from engineeringkit.signal_processing import Spectrum

fs = 1000
t = np.arange(1000) / fs
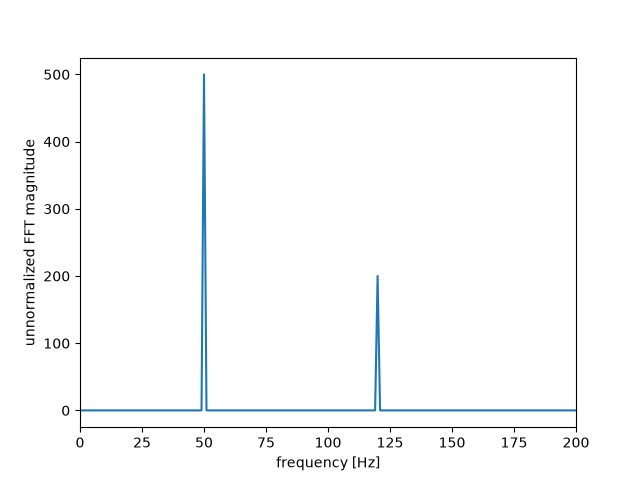
x = np.sin(2 * np.pi * 50 * t) + 0.4 * np.sin(2 * np.pi * 120 * t)
spectrum = Spectrum.from_signal(x, fs)
fig, ax = spectrum.plot()
ax.set_xlim(0, 200)
ax.set_ylabel("unnormalized FFT magnitude")

plt.show()
Total running time of the script: (0 minutes 0.062 seconds)
