
Signal processing exercises#
Three problems built on the signal processing gallery. Try each one before opening its solution. The solutions run when the documentation is built, and the test suite checks every number they print.
1. Three tones, one frequency#
Tones at 300 Hz, 700 Hz and 1300 Hz are each sampled at 1 kHz for one second. Predict the frequency at which each appears in the sampled data, then confirm it from the peak of a windowed spectrum.
Builds on: Examples.
Solution
import numpy as np

from engineeringkit.signal_processing import alias_frequency, windowed_spectrum

fs = 1000.0
t = np.arange(1000) / fs
for f in (300.0, 700.0, 1300.0):
    freqs, mag = windowed_spectrum(np.sin(2 * np.pi * f * t), fs)
    peak = freqs[np.argmax(mag)]
    print(f"{f:6.0f} Hz tone: predicted alias {alias_frequency(f, fs):.0f} Hz, spectral peak {peak:.0f} Hz")
    assert peak == alias_frequency(f, fs)
#    300 Hz tone: predicted alias 300 Hz, spectral peak 300 Hz
#    700 Hz tone: predicted alias 300 Hz, spectral peak 300 Hz
#   1300 Hz tone: predicted alias 300 Hz, spectral peak 300 Hz
Once sampled, the three tones are indistinguishable. No processing after the sampler can separate them, which is why an analog anti-aliasing filter must come before it.
2. Bits and signal-to-noise ratio#
An ADC spans -1 V to 1 V. Quantize a full-scale sine wave with 8, 12 and 16 bits, and measure the signal-to-quantization-noise ratio. Compare with the rule \(6.02N + 1.76\) dB.
Builds on: Examples.
Solution
import numpy as np

from engineeringkit.signal_processing import quantize, snr_db

t = np.arange(200_000)
x = 0.999999 * np.sin(2 * np.pi * 0.0123457 * t)  # just inside full scale, not a submultiple of fs
for bits in (8, 12, 16):
    xq = quantize(x, -1.0, 1.0, bits)
    measured = snr_db(x, xq - x)
    print(f"{bits:2d} bits: SNR {measured:5.2f} dB, rule {6.02 * bits + 1.76:5.2f} dB")
    assert abs(measured - (6.02 * bits + 1.76)) < 0.1
#  8 bits: SNR 49.86 dB, rule 49.92 dB
# 12 bits: SNR 73.95 dB, rule 74.00 dB
# 16 bits: SNR 98.08 dB, rule 98.08 dB
Each extra bit halves the step and so buys 6 dB. The rule assumes the quantization error is uniform and uncorrelated with the signal, which holds for a busy signal; a sine at a submultiple of the sampling rate would repeat the same few errors and break it.
3. FIR or IIR?#
At a 1 kHz sampling rate, compare a 41-tap Hamming-window FIR low-pass filter with a fourth-order Butterworth, both with a 100 Hz cutoff. Find the attenuation of each at 200 Hz, and the group delay of each at 10 Hz and 90 Hz. Which one would you use to filter a heartbeat recording, where the shape of the waveform matters?
Builds on: Examples.
Solution
import matplotlib.pyplot as plt
import numpy as np

from engineeringkit.signal_processing import butterworth_lowpass, db20, fir_lowpass, frequency_response

fs = 1000.0
filters = {"FIR, 41 taps": (fir_lowpass(41, 100.0, fs), 1.0), "Butterworth, order 4": butterworth_lowpass(4, 100.0, fs)}
delays = {}
fig, ax = plt.subplots(figsize=(5, 3.2))
for name, (b, a) in filters.items():
    f, H = frequency_response(b, a, worN=4096, fs=fs)
    delay = -np.gradient(np.unwrap(np.angle(H)), 2 * np.pi * f / fs)   # samples
    d10, d90 = delays[name] = np.interp([10.0, 90.0], f, delay)
    print(f"{name:20s}: {db20(abs(np.interp(200.0, f, abs(H)))):6.1f} dB at 200 Hz, group delay {d10:5.2f} / {d90:5.2f} samples at 10 / 90 Hz")
    ax.plot(f, delay, label=name)
# FIR, 41 taps        :  -62.2 dB at 200 Hz, group delay 20.00 / 20.00 samples at 10 / 90 Hz
# Butterworth, order 4:  -28.0 dB at 200 Hz, group delay  4.04 /  6.52 samples at 10 / 90 Hz
assert np.allclose(delays["FIR, 41 taps"], 20.0) and np.ptp(delays["Butterworth, order 4"]) > 2
ax.set(xlabel="frequency [Hz]", ylabel="group delay [samples]", xlim=(0, 150), ylim=(0, 25))
ax.legend()
fig.tight_layout()
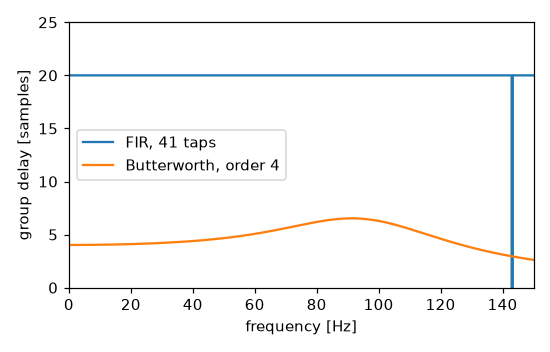
The FIR filter delays every frequency by exactly 20 samples, half its length, so it shifts a waveform without distorting it. The Butterworth needs 10 coefficients instead of 41 and delays the signal far less, but its delay grows by 60% across the passband, which bends the shape of a sharp waveform such as an ECG’s QRS complex. For a heartbeat, use the FIR.